Build useful process reports
A process report helps people answer a business question. Nadia might want a table of leave requests waiting for review, a chart of how long approval takes, or a list of tasks that have not yet been claimed.
Start with that question, then choose what one row means. If a table mixes requests, tasks and visits to a stage without explanation, its totals can be misleading even when the numbers are correct.
Before you begin
You need an interface you can edit, an available published lifecycle and permission to read the intended data. Use a development workspace with fictional cases while learning. Save the interface before connecting data.
A published report does not grant its readers access to private requests or fields. Test it as a representative user after the application administrator has prepared the intended access.
First decide whether you need Live or an application report
Nadia first asks, “What is happening in this published process now?” She can answer an operational question in Live → Report. Later she wants a permanent table that employees can open inside the leave application. That is a different authoring task: connect a DataGrid or Chart, or use an offered lifecycle-report recipe in Interface Designer. Opening Live Report does not insert, save or publish an application report.
These illustrations use the ordinary Workflow Designer account in the synthetic People Operations workspace, with workspace Editor access and no super-administrator or platform bypass. They show the currently retained training build from source 5bd4bae3 on 18 November 2026. The three states belong to Manuals Demo Leave Approval, published version 1. A separate draft exists; it is not a running case. No employee request, manager task or decision was created in this walkthrough. These images explain the visible reading controls and actual empty state; later populated-case examples remain instructions to follow with appropriately prepared fictional work.
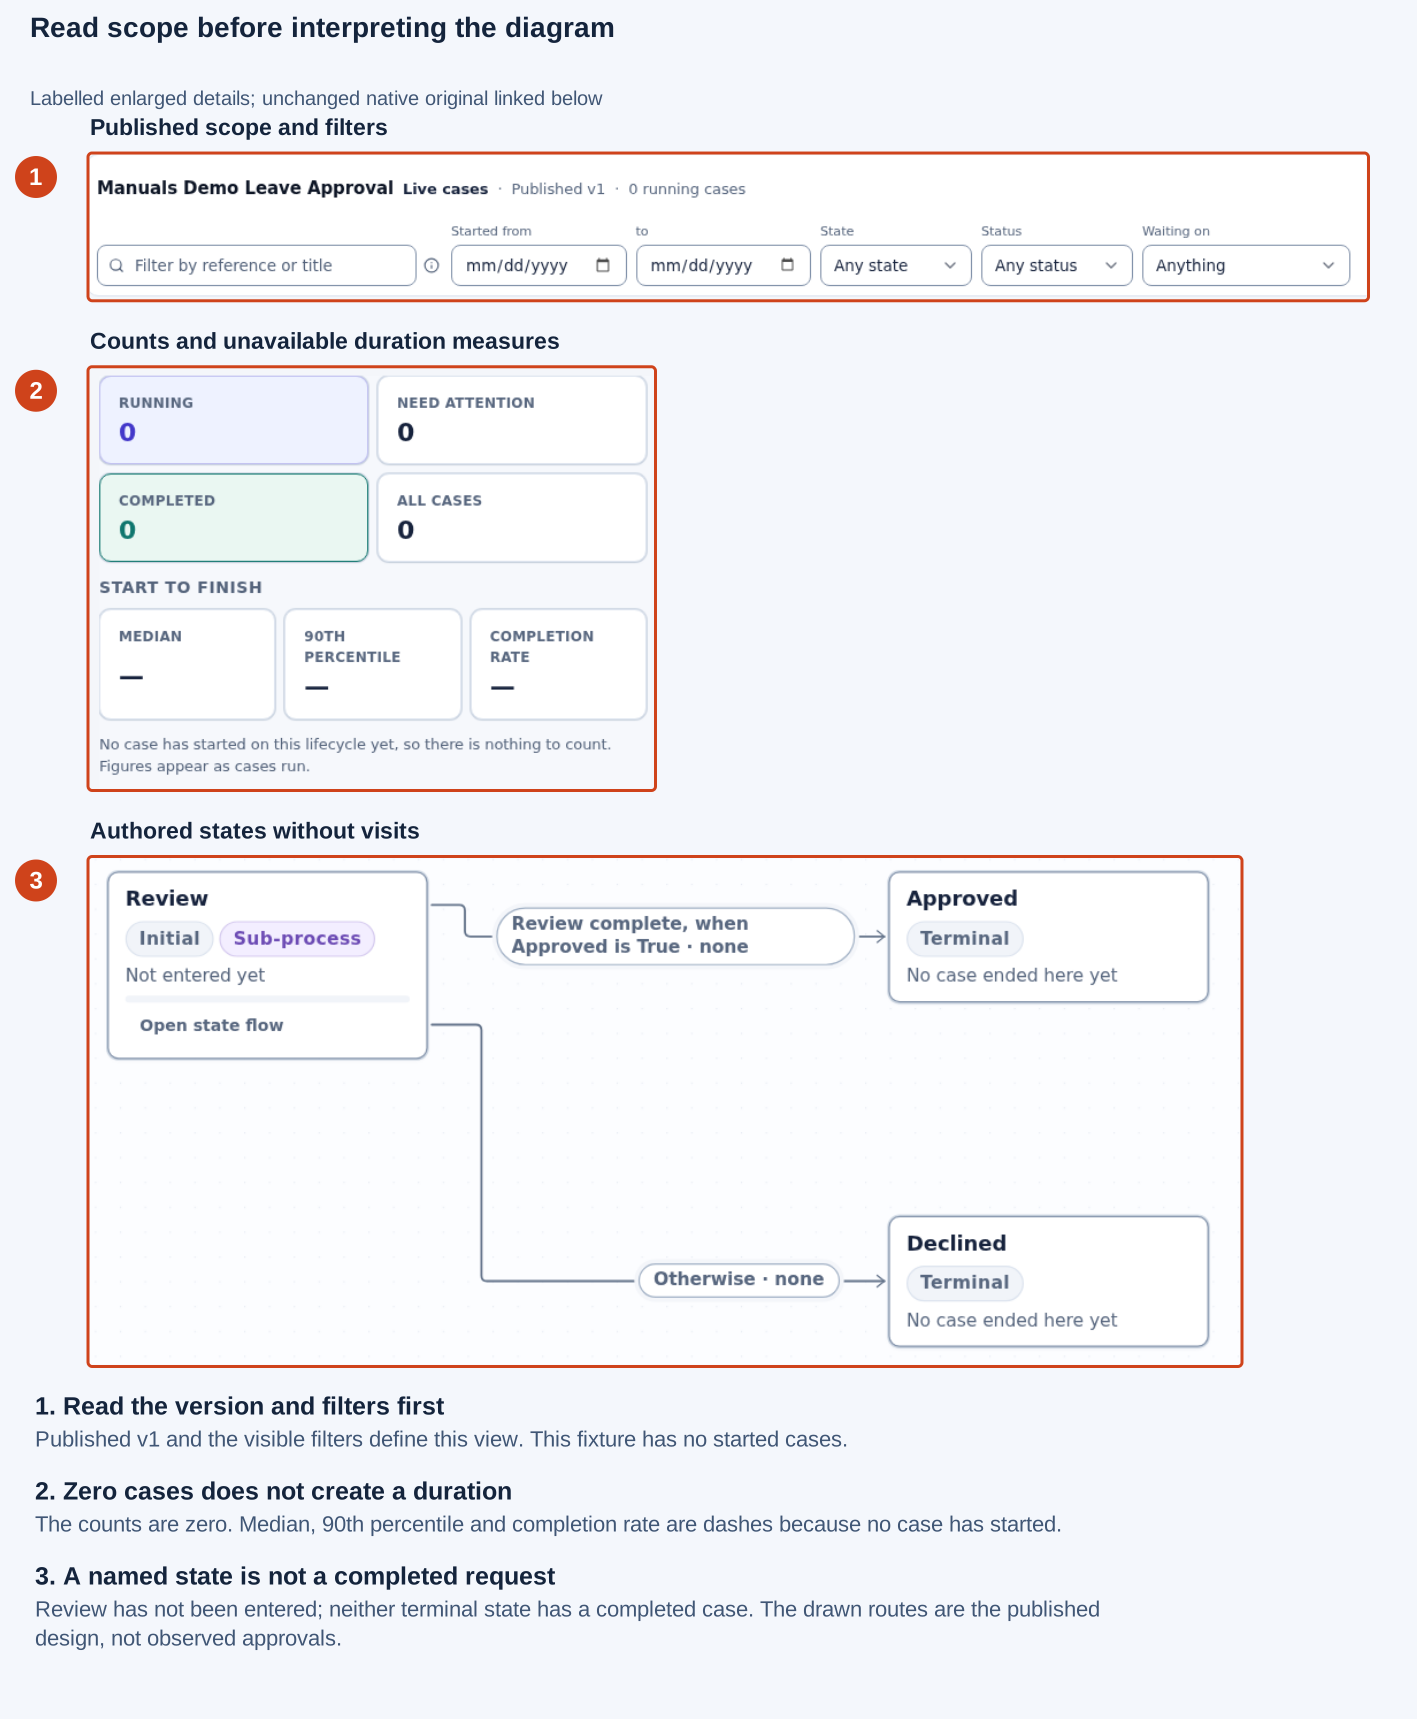
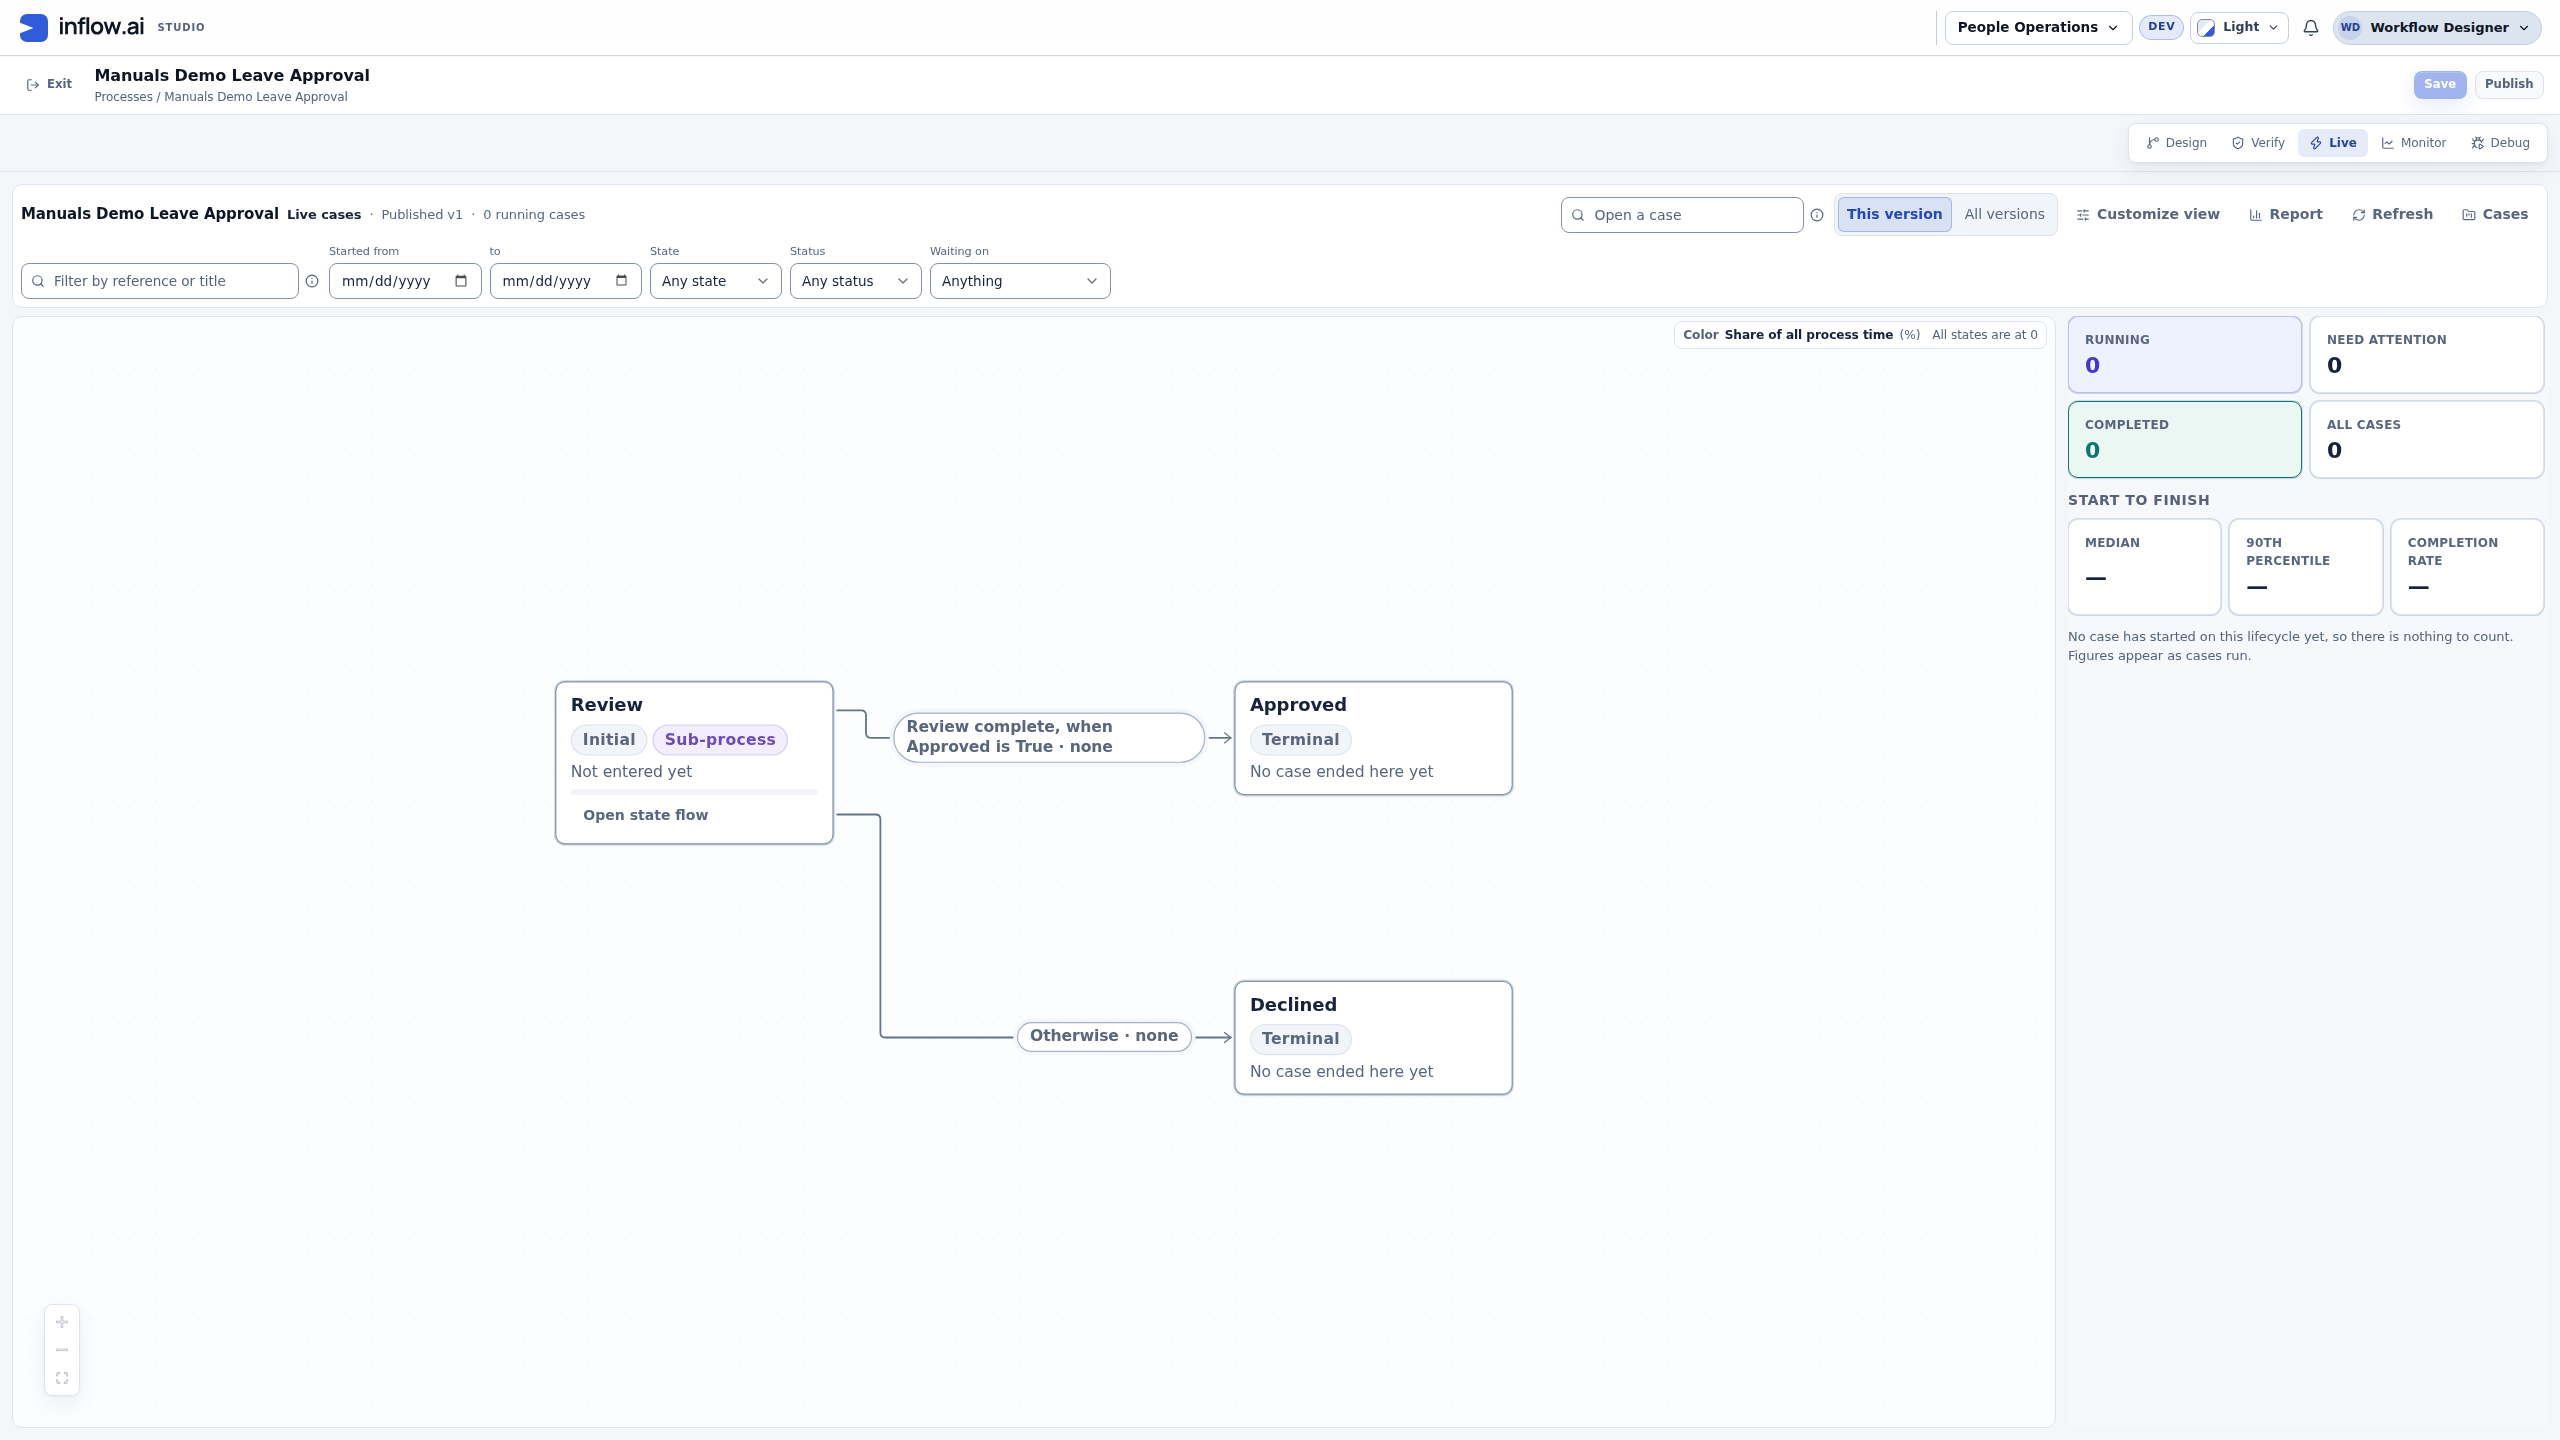
Actual operational entry: the Live overview names Published v1 and its selected population. These controls belong to the process view; they are not the Connected data wizard in Interface Designer. Open the unchanged native 2560×1440 screenshot. The numbered guide enlarges labelled details from that single capture.
-
Read the version and filters first. Published v1 and the visible filters define this view. This fixture has no started cases.
-
Zero cases does not create a duration. The counts are zero. Median, 90th percentile and completion rate are dashes because no case has started.
-
A named state is not a completed request. Review has not been entered; neither terminal state has a completed case. The drawn routes are the published design, not observed approvals.
-
Identify whether the question concerns the current operational population or a report to publish inside an application.
-
For the operational question, open the intended published lifecycle in Live and check This version, any filters and the case count.
-
Choose Report. Its values describe the same selected population as the Live diagram. The report is not an independent source of unfiltered business totals.
-
If there are no cases in view, read the empty-state sentence instead of treating missing charts or dashed measures as measured results.
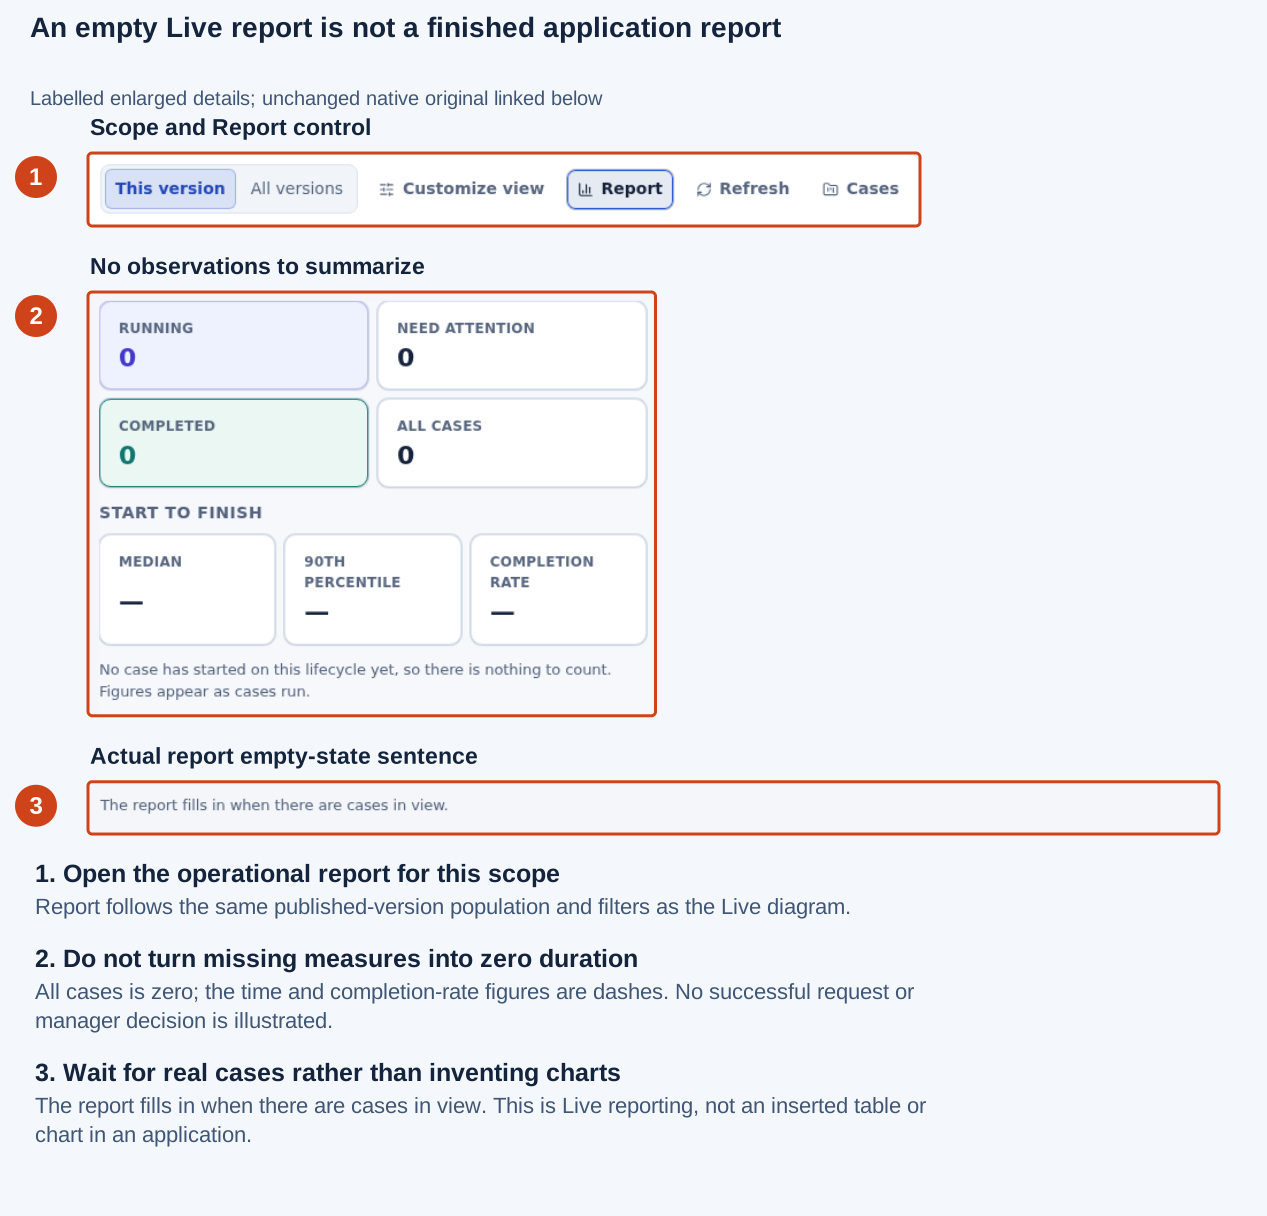
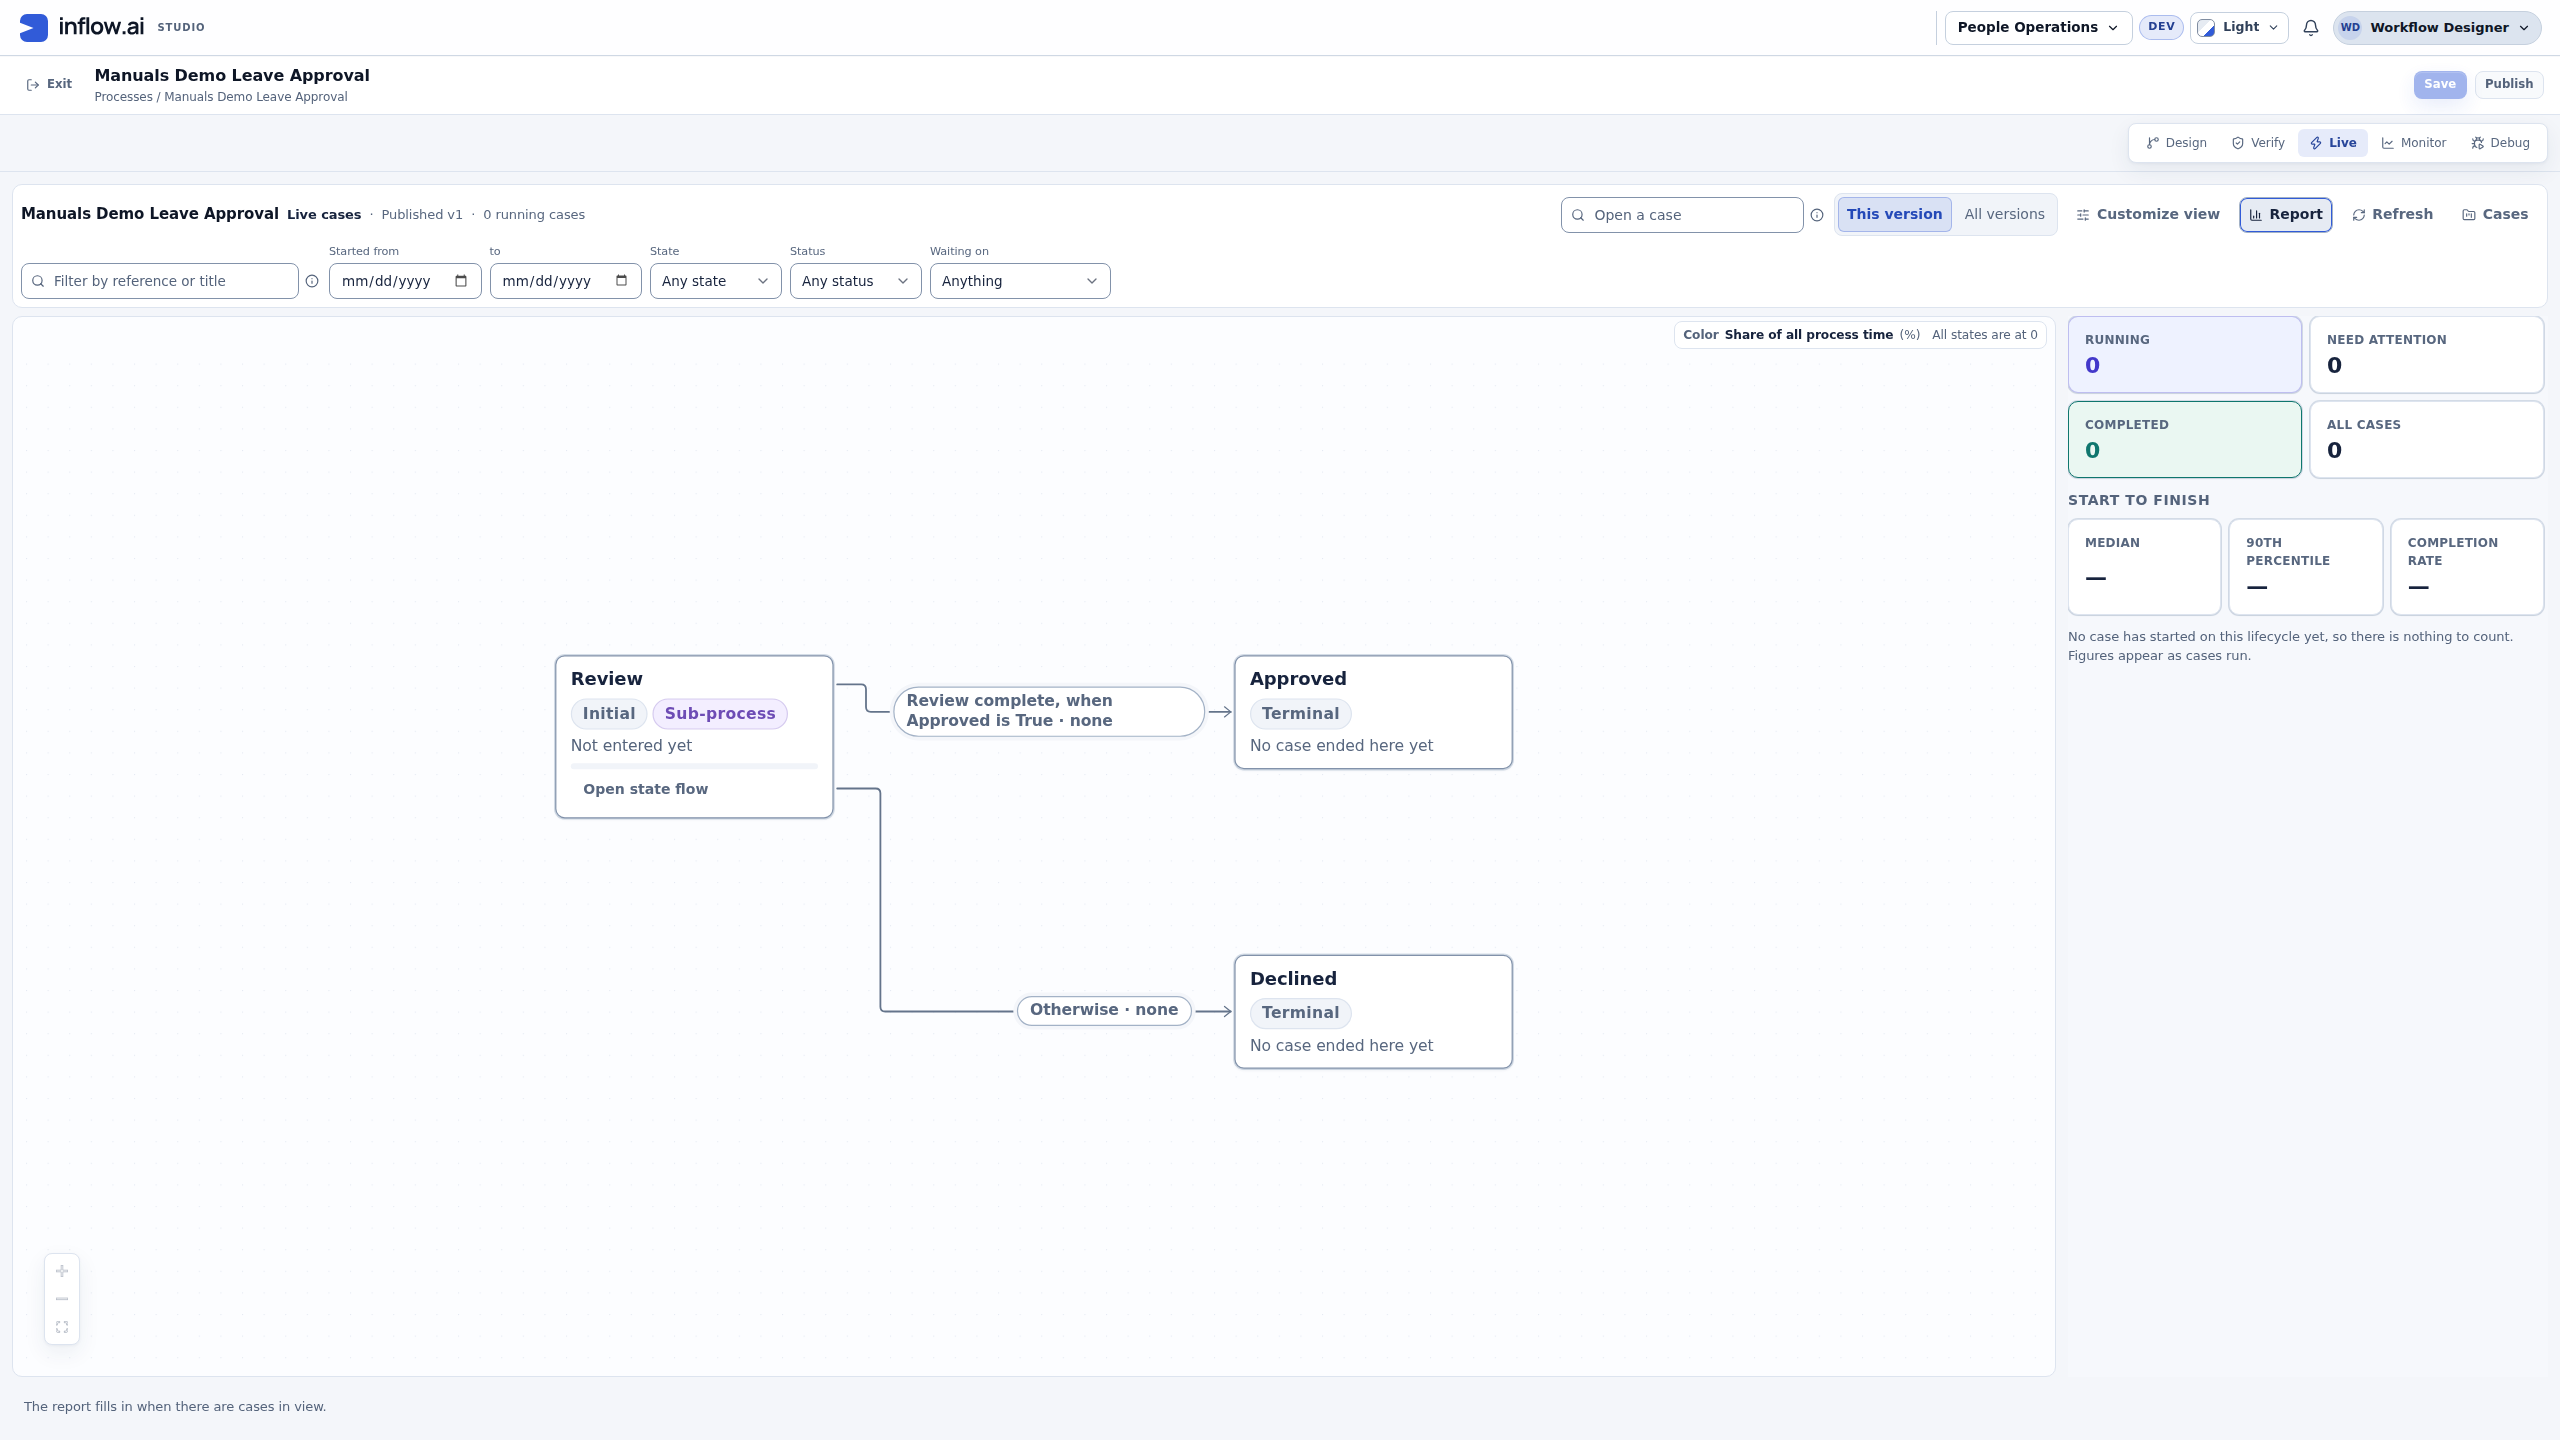
Actual Live report with no cases: The report fills in when there are cases in view. The existing zero case counts and dashed duration measures remain visible. No populated chart, application report connection or completed request is demonstrated. Open the unchanged native 2560×1440 screenshot. The numbered guide enlarges labelled details from that single capture.
- Open the operational report for this scope. Report follows the same published-version population and filters as the Live diagram.
- Do not turn missing measures into zero duration. All cases is zero; the time and completion-rate figures are dashes. No successful request or manager decision is illustrated.
- Wait for real cases rather than inventing charts. The report fills in when there are cases in view. This is Live reporting, not an inserted table or chart in an application.
| Question | Appropriate route | What to verify |
|---|---|---|
| “How is this published process doing now?” | Live and its Report control | The selected version, filters, population and available measures. |
| “Why are there no report figures?” | Read the actual Live population and empty or failed state first | An empty successful read is different from unavailable data. Do not invent zero durations or create cases only to make charts appear. |
| “Can employees open this table in the leave application?” | Interface Designer’s governed data connection or offered report recipe | The actual source, row meaning, field selection, reader access and saved/published interface. Live Report alone does not establish any of them. |
Check your result: Nadia can distinguish a useful operational view from the permanent report she still needs to author. The illustrated fixture does not demonstrate the connection wizard, a saved report, populated business data or an ordinary employee's report access. Follow the separate procedures below with the intended permitted source, then verify the real published reader experience.
Choose the right starting route
There are two useful ways to begin. They are separate tools, so their choices are not identical.
| Starting route | Use it for | How to begin |
|---|---|---|
| Connect data → Lifecycle data | A table/chart about lifecycle cases, their variables, stage visits, tasks or history. | Select a DataGrid or Chart and use Connected data. |
| Insert lifecycle report | An offered report recipe that already matches the question, such as a task report. | Use the report wizard in Interface Designer. |
DataGrid means the table control. Lifecycle data is a source: a place the interface reads its report information. A field becomes a column or a chart value. A filter limits which rows the report includes.
Connect a table to Lifecycle data
- Open the interface in the designer and Save it. An unsaved interface cannot complete the governed data connection.
- Add a DataGrid and select it.
- In its properties, open Connected data and choose Connect data. If it already has a connection, the action is Replace connected data.
- On Source, search for Lifecycle data or find it under the available source categories. Select it and choose Next.
- On Lifecycle data settings, answer What should each row represent? For an ordinary request list, choose Lifecycle instances.
- Choose the intended lifecycle model, such as Leave requests. If the screen asks which model's variables to show, confirm the matching model instead of a similarly named one.
- Review Versions and Filters. Begin with a small clear scope, such as the intended cases in Review. If a filter needs a value, fill it or remove that unfinished condition.
- Read the Data preview. Check what one row means, the total and a few fictional records. Use Refresh if you need a new preview.
- Choose Next and select the fields in Fields. Read the ordered Selected fields list: for a table this becomes the column order.
- In the table's Interactions step, choose only the reader features you want, such as Search, Filters and sorting, from the options actually offered.
- On Review, check the source, scope, columns and interactions. Finish with Connect data for a new connection or Save connection for an edited one. Before this final action, the wizard's choices are still a draft.
- Save the interface and use Preview. When it is ready, publish the interface and check the permitted reader experience.
Check your result: the table answers one understandable business question. Its columns, total and filters agree. Cancelling the wizard does not apply its unfinished choices.
Know what one row represents
| Level | One row represents | Typical question |
|---|---|---|
| Lifecycle instances | One running or historical business case. | Which leave requests are in Review? |
| Lifecycle instance | The chosen individual case and its information. | What values belong to Mohammad's selected request? |
| State visits | One visit by a case to a stage. | How long did requests stay in Review? |
| Tasks | One human task. | How long did work wait before somebody claimed it? |
| Variable history | A recorded change to selected case information. | When did the requested days change? |
| Lifecycle model | Information about the process design. | What does the selected published process contain? |
One case can visit a stage more than once or have several tasks. Counting task rows is not the same as counting employee requests. Choose the level before deciding which total to place on a dashboard.
Example: a table of requests waiting for review
The business question is Which requests need a manager's attention?
- Connect a DataGrid to Lifecycle data and choose Lifecycle instances for Leave requests.
- Apply the appropriate current-stage filter for Review using the offered filter fields.
- Select the business reference, current stage and the dates/employee fields your audience is allowed to see. Arrange them so the reference and next action are easy to recognize.
- Preview several fictional requests. Open a known request separately to confirm that the table describes the same current stage.
- Test the filter and Search behavior if you enabled them.
The result is a request list, not every manager task. If you need to show task assignees or claimable work directly, use a task-level/report design appropriate to that purpose and its supported task-opening destination.
Turn a connection into a useful chart
A chart needs an explicit grouping and a numeric value. Category is what separates the bars or points; series separates groups within them; value is the number being summarized.
- Add a Chart, Save the interface and open Connect data.
- Choose Lifecycle data and the level that matches the business question.
- Select the required date/category fields and numeric or duration fields. Charts have Source, Lifecycle data settings, Fields and Review; they do not have the table's Interactions step.
- Finish the connection, then open Governed chart mapping → Configure mapping in the properties.
- Choose the category, any series, the value and an offered summary method. Read the units before comparing values.
- Preview the chart and compare a small sample with its underlying cases or visits.
A title such as Average review time by week tells readers much more than Chart 1. Include the time period and units in the reader-facing explanation.
Example: show time spent in Review
Nadia wants to compare review speed over the last month.
- Use State visits, because the question concerns each visit to Review.
- Select the available stage, entry date and time-in-state fields, then filter to Review and the intended dates.
- Configure the chart's category as the chosen date grouping and its value as the intended duration measure.
- Preview a known short visit and a longer one. Confirm that both are in the chosen period.
- Explain what happens when a request visits Review twice: those are separate visits, not an accidental duplicate employee request.
A chart based on task work time would answer a different question. It might exclude the time a request spent waiting before the manager began, so do not present it as the whole approval time.
Read task waiting time and work time separately
A task can wait before a person begins, then take time to handle. The task level offers the relevant measures. Choose the actual fields offered for the question rather than assuming every duration describes the entire process.
For a useful comparison:
- Choose Tasks and the intended lifecycle/date scope.
- Select the task's recognizable name/reference and the waiting/work duration fields offered by the source.
- Preview tasks at different stages: unclaimed, assigned and completed, where your role may view them.
- Read empty or unfinished durations as their actual state. An unfinished task does not necessarily have a final work duration of zero.
- Explain the two measures beside the report so readers know which delay they can improve.
Example: one manager task waits two days before it is claimed and takes fifteen minutes to complete. A staffing or assignment change may address the two-day wait; redesigning the form addresses the fifteen-minute work. Treating those as one number hides the difference.
Use working hours when the business question needs them
Calendar time counts elapsed time. Business time counts only the working periods of the chosen Business calendar, including its time zone, holidays and exceptions.
Business-time fields are marked (business). Choosing a calendar does not turn every plain duration field into a business-time field automatically.
- Ask the workspace administrator which prepared calendar the business target should use.
- In the applicable Lifecycle data settings, choose Business calendar.
- Select the duration fields marked (business) when you want working-time figures.
- Read the report's Business time caption to confirm which calendar was used.
- Compare an example across a weekend or holiday with the plain calendar-time field.
Example: under a Sunday–Thursday working week of 08:00–16:00, a visit from Thursday 15:00 to Sunday 09:00 spans the weekend. It contains two working hours: one on Thursday and one on Sunday. That is not the same as two elapsed hours.
If the calendar list cannot be loaded, keep the saved choice and use the displayed recovery. If a chosen calendar was removed, review the warning and select the intended available calendar. Do not silently compare a default calendar with an earlier named-calendar figure and call it the same measure.
Understand median and longer-delay measures
An average can be influenced by a few very slow cases. Median means the middle duration after sorting the observations. A 90th percentile summarizes a point near the longer end of the observed durations; it is not a promise that every future request will finish within that time.
For three review durations of 1 hour, 2 hours and 12 hours, the median is 2 hours. It describes the middle request. The average is 5 hours and tells another useful story: one long delay raises the overall mean.
Where the chart offers these summaries, read the actual choice and units. Give the report a title that says whether it shows an average, median or 90th percentile. For small samples, inspect the underlying rows instead of treating a statistical label as proof of a stable service target.
Report on past values deliberately
Current values answer what the case contains now. Variable history answers how selected information changed. As of asks for the view at a chosen time where the source level supports it.
- Choose the case or lifecycle scope first.
- Choose the historical level or As of setting appropriate to the question.
- Select the needed variable(s) and date range rather than displaying every field without purpose.
- Compare a small known fictional change with the preview.
- State the chosen time in the report's explanation.
Example: a leave request changed from three days to five days. A current report can correctly show five, while a historical view before that change can correctly show three. Neither should be described as the other. If the history is unavailable, the correct result is a limitation, not a guessed old value copied from today's record.
Use an offered report recipe
The Insert lifecycle report wizard is useful when a ready-made recipe already matches the question.
- Open it in Interface Designer and search the available report templates.
- Choose the recipe by its business purpose, then read Lifecycle scope.
- For a report about Leave requests, choose the actual lifecycle in the offered selector. Review any recipe-specific parameters.
- For a task-row report, configure the actual permitted Task viewer destination and Task link activation where requested. A summary row is not a task you can open by inventing a destination.
- Read Review report, insert it and refine the resulting DataGrid through its ordinary properties.
- Preview, Save and publish after checking the reader's intended experience.
This route does not offer every history option from Lifecycle data. Keep existing useful recipe reports; choose Lifecycle data when you need its explicit row levels, variable history or As of behavior.
Versions and sensitive information
A model selection can determine which current fields are offered while cases themselves retain their actual published versions. A stage that existed only in an older version may need a State visits view rather than a new per-stage column based on the latest design.
Some case fields are sensitive. Only choose fields your business purpose needs, and read any publication review prompted by their use in sorting, filters or chart mappings. Publication is not a bypass of the reader's current access. A person can have permission to open the report without seeing every private value used by its owner.
Common mistakes
| What goes wrong | What to check |
|---|---|
| Next is unavailable. | Read the nearby reason: a model, selected case, date, filter value or field choice may still be missing. |
| The table total is larger than the preview rows. | The preview is a page of the result; read its total and pager. |
| Task rows were reported as employee-request counts. | Change the level or explain that the report counts tasks. |
| A chart has fields but no useful bars. | Configure category/value mapping and select an appropriate numeric or duration field. |
| A weekend delay looks too large or too small. | Compare calendar-time and (business) fields and read the selected calendar caption. |
| An old stage is missing as a new column. | Check the model/version used to offer fields; use State visits for earlier-stage history where appropriate. |
| Blank values are treated as zero. | Read whether the value is empty, unfinished, hidden or unavailable. |
| The report works for Nadia but not a normal employee. | Check current access to the report, process, cases and fields as that employee. |
Where to go next
Use the query-driven application tutorial for connecting a useful table to a page, and Live for operational inspection. The optional technical reporting reference retains the full specialist contracts and detailed field catalogue.