
Optional technical reference. This material is for developers, integration specialists and platform administrators. For the consultant lesson, read the practical guide.
Preserved from source baseline
d4587c7c0e073e58c2d430342f65ac55dd701bf4; source/static examples retain their stated scope. They are not new runtime verification or required consultant setup steps.
Lifecycle reporting with the Lifecycle data source
Start with a question, not a field list
This guide has two layers. The recipes here answer common business questions; the detailed reference below preserves field semantics, disclosure rules, time calculations and edge cases. Begin with the recipe, then follow its specific reference section when the result needs explanation.
For the shared people-ops example, Sara asks: Which leave cases are waiting for Review, how long have they waited, and which information may I see? She needs an admitted lifecycle model and a screen whose authored DataGrid/Table/Chart configuration uses the supported Lifecycle data contributor. A category in Connect data is discovery, not a promise that every control can run every adapter. A report can be a published app screen or an authorized designer preview; their rights differ.
Reporting preparation checklist
- Choose the actual lifecycle and deliberate version scope. Cases already running on older releases remain meaningful data.
- Decide whether the question concerns cases, states, tasks, incidents or elapsed/business time. These are different grains and must not be summed indiscriminately.
- Select only the fields the contributor exposes and the current reader may disclose. A visible case is not a blanket variable grant.
- Configure binding/filter values in the authored node and review the permitted preview; keep missing/protected/unavailable distinct from a genuine empty value.
- Publish the screen when appropriate, and read its actual page metadata, column metadata and notices together.
| Query coordinate | Meaning |
|---|---|
version or authorized draft:true |
Published Screen identity versus managed draft preview |
nodeId |
The authored reporting control, not a client-selected arbitrary query |
search, filters, sort, page |
The strict supported query envelope and contributor capabilities |
bindings |
Values for the configured binding contract; not authority to add fields |
sampleInstanceId |
An admitted sample coordinate where that designer path supports it |
columns, notices, emptyReason |
Response evidence needed to interpret the rows honestly |
The ordinary published read needs its actual Screen and lifecycle/case scope; draft reads need Screen management. The source parser limits request fields and size. The examples are synthetic/source-reviewed, not a new executed report acceptance claim. See the query-driven tutorial for the adjacent data/rule setup.
Worked examples
Example FLOW-LR-01 — Build a table of leave cases waiting for Review
Scenario and inputs. Sara has ordinary access to the people-ops published leave application. Nadia has authored a Lifecycle data table node pendingLeave on published screen version 1 and configured the relevant model/state selection. Use the real node ID/version from that saved screen. This complete request envelope does not include an arbitrary lifecycle SQL or field list.
{
  "version": 1,
  "nodeId": "pendingLeave",
  "page": {
    "index": 0,
    "size": 20
  }
}
Procedure. POST it to /api/screens/{screenKey}/lifecycle-data-query using the admitted session/workspace. Read returned items with page, size, totalItems, hasMore, nextCursor where supplied, and the response columns/notices. In the designer, choose the visible case reference/state/request information through Connect data; configure supported filtering there rather than inventing hidden request fields. Follow the actual row navigation into its permitted case.
Expected result. The table answers its authored question using current authorized rows. A page shorter than the total is still a valid page, not a count error. Source selection comes from the server-owned node.
Failure and recovery. Unknown top-level/nested fields and malformed envelopes are refused. An inaccessible source or failed read is not an empty report; do not fill it with sample cases or requery through an unscoped endpoint.
Sources. LifecycleDataQueryController.java:36; LifecycleDataWire.java:43.
Example FLOW-LR-02 — Explain zero working time during a real overnight wait
Scenario and inputs. Mohammad submitted a leave request after the organization’s working period. The case has positive calendar elapsed time when Sara checks it the next morning, but its selected business-time measure can still be zero. The report must have an actual admitted business-time field and calendar; browser locale is not the work schedule.
Procedure. Inspect the response’s business-calendar metadata when the selected fields require it: calendar identity, name, fallback and supported zone/weekly periods. Compare the selected calendar-time and business-time measures for the same case/grain. When a row supplies outsideWorkingHours, interpret it as the listed business-time fields whose zero reflects time outside the working period, not as a new case variable. Display the source’s supported explanatory presentation alongside the zero.
Expected result. A reader can distinguish “0 sec outside working hours” from no measurement or no wait. The chosen calendar, timezone and field grain explain the value without changing the workflow timer or starting another measurement.
Failure and recovery. Missing calendar/time evidence is unavailable, not an instruction to guess a regional workweek or write zero. If the fallback calendar is shown, report it honestly and have the authorized calendar owner review configuration; do not alter shared calendars while diagnosing a report.
Sources. LifecycleDataWire.java:27; LifecycleDataWire.java:74.
Example FLOW-LR-03 — Keep a protected variable protected in the same report
Scenario and inputs. The table includes a case-file field that one manager may inspect but another reader may not disclose. Both users may be able to see the lifecycle or selected case. The test story uses synthetic values and distinct real permission profiles; a builder’s preview alone cannot establish the second reader’s behavior.
Procedure. Select the field through the admitted column/field UI and read the report separately under each permitted reader. Inspect actual column, notice and protected-value behavior rather than treating every missing cell as an empty answer. Check dependent filtering, sorting, links and export using only the capabilities currently offered. Follow the field’s actual disclosure policy when building detail pages; do not retrieve its value again from generic agent memory or another broad read surface.
Expected result. The table can present the case while withholding a protected value. The hidden value does not become available merely because its column name, case reference or model is visible. The report’s bounded hydration path retains its own authorization.
Failure and recovery. Do not replace a protected marker with null/zero/blank business data, leak it in a filter or let a visible total reveal a broader unauthorized set. A transient policy/read outage remains unavailable; retry the admitted read without broadening scope.
Sources. LifecycleDataService.java:1; LifecycleDataServiceNeverRevealHydrationTest.java:1.
Example FLOW-LR-04 — Read a reporting period that spans two releases
Scenario and inputs. Nadia publishes a later leave lifecycle whose case-file contract changes, while older requests remain on the earlier version. Sara’s reporting period intentionally includes both. The guide must explain which variables exist on which actual release instead of assuming the latest declaration applies retroactively.
Procedure. Choose the report’s model/version scope deliberately in Connect data. Inspect the available field metadata for that scope and select supported columns. Keep each row’s actual case/reference and model evidence with its value interpretation. Compare a known older synthetic case to a newly started case with the revised field. Where the current contributor marks a field incompatible, absent, protected or unavailable, preserve that distinction in the page and its explanatory text.
Expected result. The report retains older case meaning and the selected release scope. It does not silently cast an older value using today’s draft schema or create a default merely to make all rows visually identical.
Failure and recovery. If a field or historical model cannot be resolved, inspect the pinned source and current column/notices contract. Do not substitute latest, infer an answer from the label, or sum different state/task/case grains as though they were one measure. Source review here does not certify real mixed-release report execution.
Sources. LifecycleModelResolver.java:1; LifecycleDataService.java:1.
Detailed reference
Current contract owners are LifecycleDataService and
LifecycleDataQueryController in platform-monolith. Grid levels and fields are
validated against the exact admitted lifecycle source; current reader scope also
limits protected model names and returned rows. Screenshots and dated candidate
results below retain their original provenance. This guide is not an exhaustive
current-head certification of every field, calendar or aggregate combination.
This manual is for consultants who build dashboards, App Shell pages and task forms in Studio. It explains how to use Lifecycle data, the Connect data source for reporting on lifecycle models, their lifecycle instances and the history of their variables. It covers every setting, shows worked examples, and explains who sees which values and why.
The words in bold that describe lifecycles (lifecycle model, lifecycle instance, state, state process, step, lifecycle variable, process variable, variable history, level) have one exact meaning each. They are defined in the Glossary at the end. Other Studio pages sometimes say "case" for a lifecycle instance; this manual does not.
Contents
- What Lifecycle data is
- Before you start
- The common path: connect a table or chart
- Choosing the lifecycle model
- Level: Lifecycle instances
- Level: Lifecycle instance
- Level: Variable history
- Level: Lifecycle model
- Variable history and As of, worked through
- DataGrid or Chart
- The "Lifecycle model" constant
- Versions
- Who sees what
- Cell states and what they mean
- Performance and limits
- Language and direction
- Troubleshooting
- Lifecycle data and the "Insert lifecycle report" wizard
- Level: State visits
- Level: Tasks (lag time and work time)
- Time in states: per-state columns
- Business time and the Business calendar picker
- Duration charts: format, Median and 90th percentile, trends and transitions
- Business calendars (administration)
- Glossary
- Screenshot list (to do)
1. What Lifecycle data is
Lifecycle data is one data source in Connect data. You find it under its own category, also called "Lifecycle data". Its description in the source list is:
Lifecycle data — Lifecycle models, their instances and variable history, with typed variables.
You can connect it to a DataGrid or a Chart. Other controls do not offer it. A Metric, for example, lists it as unavailable with the reason "Lifecycle data can be shown in a data grid or a chart."
The source answers six questions. Each question is a level. You pick the level first, and the level decides what one row is:
| Level | One row is… | Use it to… |
|---|---|---|
| Lifecycle instances (the default) | one lifecycle instance | list or chart the running and finished lifecycle instances of a lifecycle model, with one typed column per variable, and (optionally) the time each spent in every state |
| Lifecycle instance | one change to a variable of one lifecycle instance (or, with Current values, one variable) | show the full change history of one lifecycle instance, for example on a task form |
| Variable history | one change to a variable, across all lifecycle instances | audit changes to one or more variables over a period |
| Lifecycle model | one variable declared on the lifecycle model | document a lifecycle model's variables: type, scope, sensitivity, where they are set |
| State visits | one visit of a lifecycle instance to a state ("One row each time a lifecycle instance enters a state.") | measure how long lifecycle instances stay in each state, how often they come back, and which transitions they take (section 19) |
| Tasks | one human task of a lifecycle instance ("One row per task of a lifecycle instance, with its lag and work time.") | measure how long tasks wait without an owner (lag time) and how long they are worked on (work time) (section 20) |
Every time field is in calendar time. Every duration also has a business-time twin marked "(business)", which counts only the working hours of a business calendar (section 22).
Four things make this source different from the older process sources:
- One row per lifecycle instance. The work a state runs (its state process instance) never becomes a row of its own. Debug and test runs are never rows.
- Typed variable columns. Every lifecycle variable and every process variable of every state is its own column, with its own type. Numbers sort as numbers and dates sort as dates.
- The lifecycle-view access rule. People with view access to the lifecycle model see every value. Everyone else sees only non-sensitive values, and only for the lifecycle instances they can already see. See Who sees what.
- Server-side scale. Paging, sorting, filtering, searching and chart totals run on the server over every lifecycle instance the reader can see. There is no 200-row preview cap.
2. Before you start
You need:
- A published lifecycle model. Drafts are not offered. The picker lists only lifecycle models that have at least one published version and that you can view.
- View access to the lifecycle model. In practice, consultants who build these pages hold it. Without it you can still connect the source, but the preview follows the same rules as for any other reader (see Who sees what).
- A saved interface. The designer preview runs against the saved draft. If the interface was never saved, the preview reads "Save the interface to preview its data."
- For task-form use: a form that receives a task, that is, an interface of kind form with a task input
(an input whose origin is the task, or an input named
taskId). The option "This task's lifecycle instance" is offered only on such forms.
3. The common path: connect a table or chart
Every level follows the same path through Connect data. The level-specific settings are described in sections 5 to 8.
In short: select the control, press Connect data, choose the source Lifecycle data, pick what each row should represent and which lifecycle model to show while the Data preview checks the result, choose the fields, and finish. The numbered steps below give every click.
The dialog
Once Lifecycle data is chosen, the Connect data dialog keeps its title and shows a subtitle that names
the control, for example Choose lifecycle data for the table "Registrations". (or Choose lifecycle data for this chart. when the control has no name). The header, the steps and the footer stay in place; each
pane scrolls on its own, and the dialog always fits in the window, also at 1024×768.
The steps are shown at the top:
- DataGrid: Source → Lifecycle data settings → Fields → Interactions → Review (five).
- Chart: Source → Lifecycle data settings → Fields → Review (four; a chart has no Interactions step).
The footer has Cancel on the left and Back and Next on the right. Between them it says where you are:
- on Lifecycle data settings, Interactions and Review: "Changes remain a draft until you finish this wizard.";
- on Fields: the selection, for example "3 selected · 2 / 100 variable columns".
Nothing is saved on the control until you press the last button on Review: Connect data for a new connection, or Save connection when the control already has a Lifecycle data connection. Cancel at any step closes the dialog and applies nothing.
Step by step
-
Save the interface. Connect data needs a saved interface. If it was never saved, the button is disabled with "Save the interface before connecting governed data."
-
Add the control. Drag a DataGrid or a Chart onto the page and select it.
-
Open Connect data. In the properties panel, under Connected data, press Connect data. (On a control that is already connected, the button reads Replace connected data.)
-
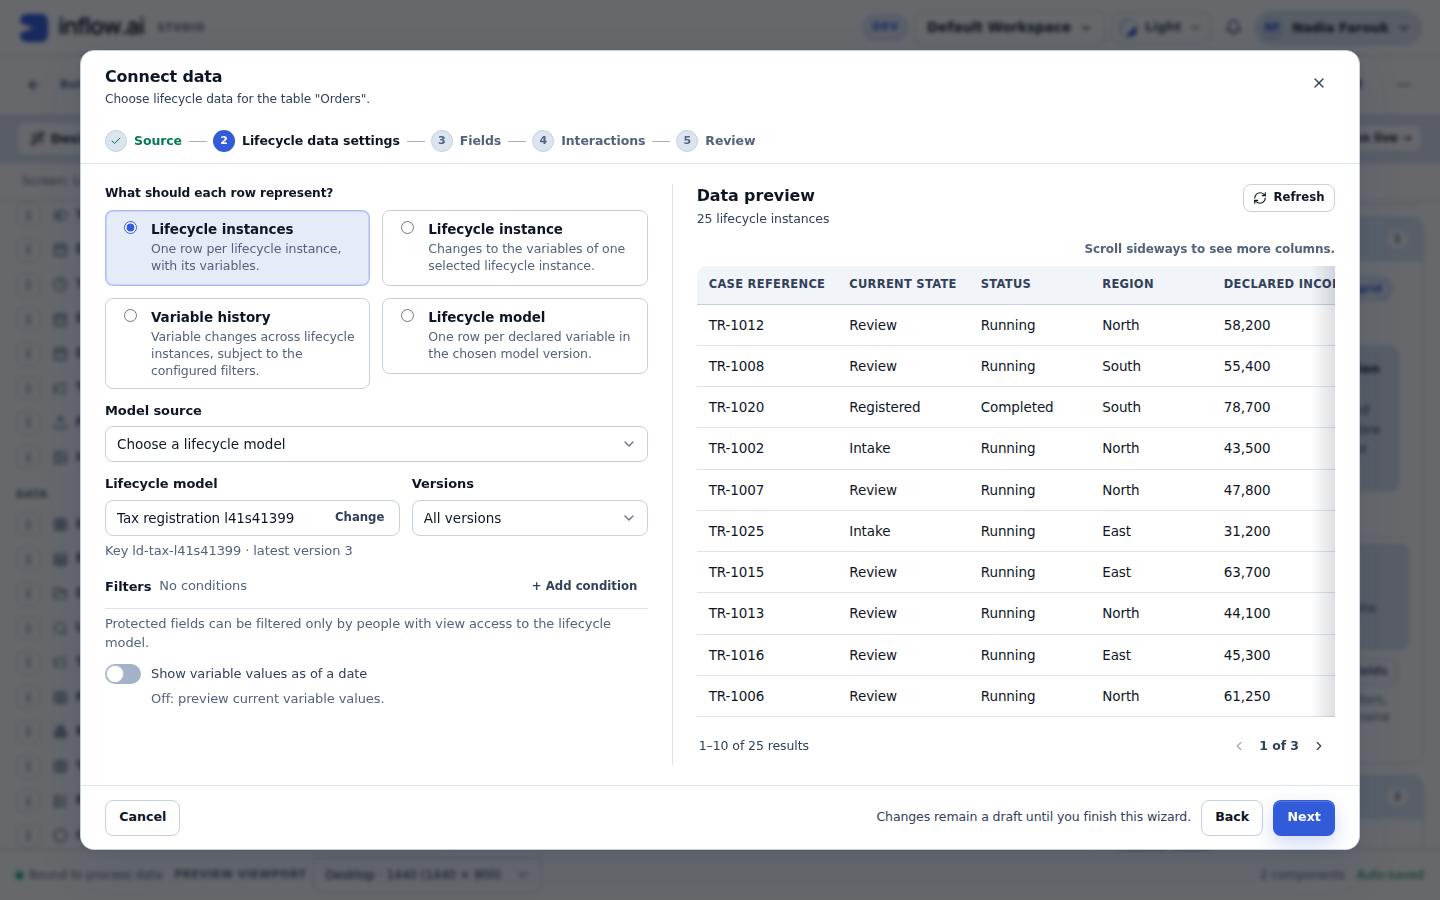
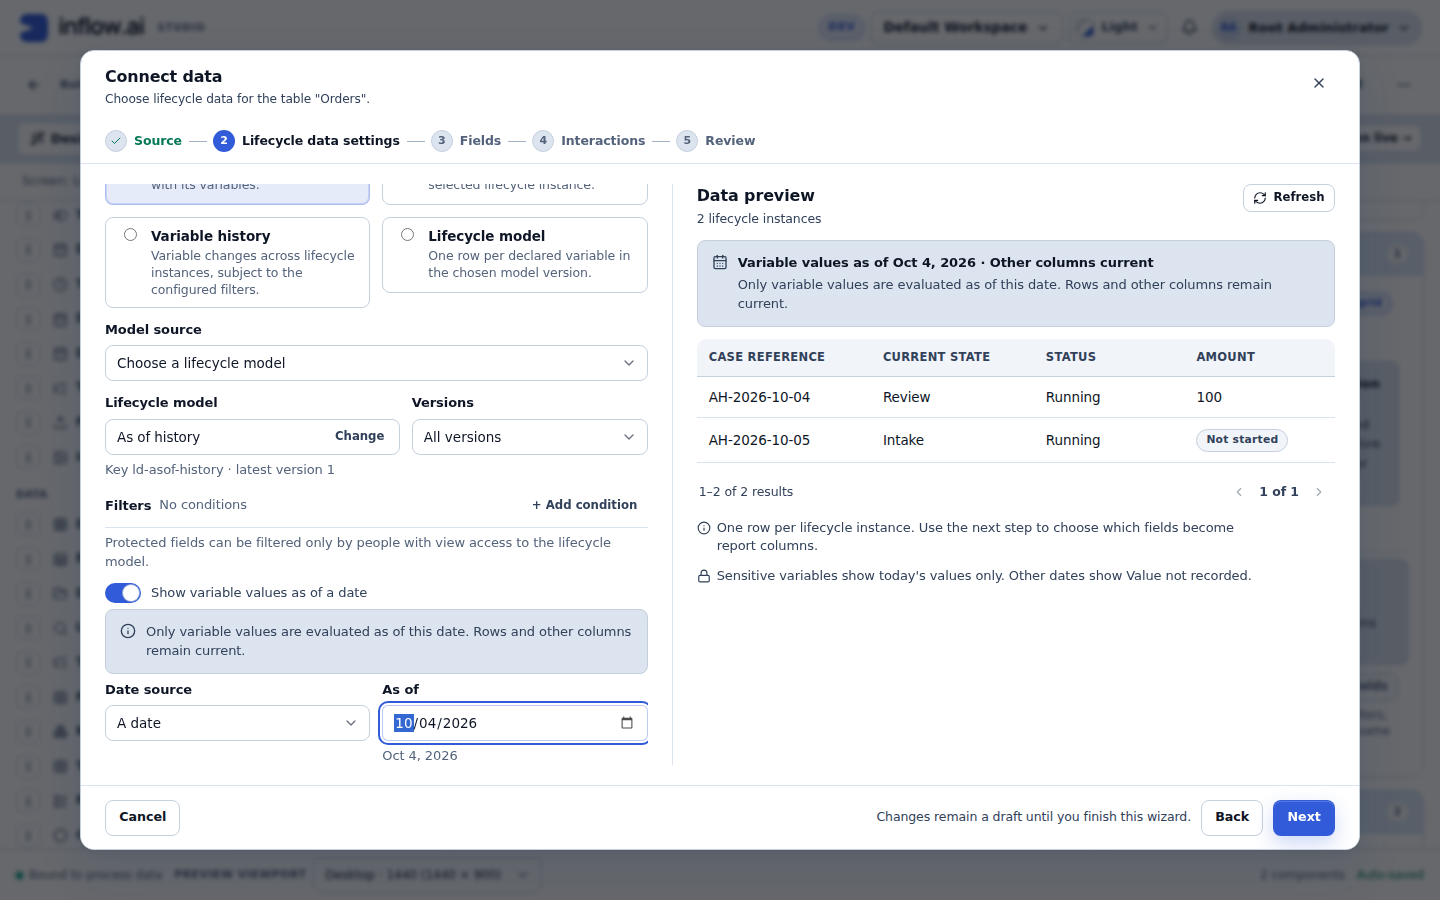
Choose the source (step Source). Lifecycle data is listed under the source kind Other (or All), in the category Lifecycle data. You can also type "Lifecycle" in the search box. Choose the source Lifecycle data and press Next. The next step is Lifecycle data settings: the settings on the left (about 45 % of the width) and the Data preview on the right (about 55 %).
-
Choose what each row represents. Under "What should each row represent?", pick one of the six tiles (Lifecycle instances is selected by default):
Tile Text on the tile Lifecycle instances One row per lifecycle instance, with its variables. Lifecycle instance Changes to the variables of one selected lifecycle instance. Variable history Variable changes across lifecycle instances, subject to the configured filters. Lifecycle model One row per declared variable in the chosen model version. State visits One row each time a lifecycle instance enters a state. (section 19) Tasks One row per task of a lifecycle instance, with its lag and work time. (section 20) Only the settings of the chosen tile are shown. If you switch to another tile and back, the settings you made for the first one are still there. Once you have visited a second tile, a note says: "Settings you made for other row types are kept while this wizard is open. Only the selected row type is saved."
-
Choose the lifecycle model. Under Model source, pick where the lifecycle model comes from: A specific lifecycle model, Use a constant, From this page or Advanced: write an expression. Only the chosen method's controls are shown, and each method keeps what you entered if you switch away and back. For most pages, A specific lifecycle model is right: press Choose lifecycle model, find the model in the dialog "Choose a lifecycle model" (each entry shows its name and "Latest version N"), and press Use lifecycle model. The model is then shown once, by name, with a Change link and a muted line such as "Key tax-registration · latest version 3". Section 4 explains the other three methods.
-
Confirm "Show variables of" (only for a constant, this page or an expression). This tells Studio which lifecycle model's variables to offer as columns. It is often prefilled, and the prefill is labelled. See section 4.
-
Set the level's options. Versions (beside the model), Filters, As of, the instance, Current values, the variables and the dates (Changed from and Changed to), depending on the level. They are all optional except the instance at the Lifecycle instance level. Sections 5 to 8 describe them.
-
Check the Data preview on the right. It refreshes by itself shortly after each complete change, and Refresh reloads it. It shows what one row means, the real total (for example "25 lifecycle instances"), a table of the first rows, ten per page, and a pager. See The Data preview below. Press Next.
-
Choose the fields (step Fields). Tick fields in the field list on the left. They appear, numbered, in Selected fields on the right. On a DataGrid that order is the column order. See The Fields step below. Press Next.
-
Choose what readers may do (step Interactions, DataGrid only). Tick Search, Filter and Sort to let readers search, filter and sort the published table. Set Selection to One record if another table on the page should show the changes of the row a reader selects (see section 6). Press Next.
-
Review and finish (step Review). Check the summary and press Connect data (or Save connection). The dialog closes and the control shows the data in the designer.
- For a DataGrid, the columns follow the order of Selected fields.
- For a Chart, Inflow proposes a starting chart you can change in the chart settings: press Edit chart under Governed chart mapping in the properties panel (see DataGrid or Chart).
-
Publish. Publish the page as usual. When a sort, filter, chart category, series or value uses a sensitive variable, publishing stops once at a Review required step. It never blocks publishing (see Review required).
If Next stays disabled, the reason is written beside it. For example: "Choose a lifecycle model.", "Choose the lifecycle model whose variables you want as columns.", "Choose which lifecycle instance to show.", "Choose the As of date.", "Choose at least one variable, or keep All variables.", "Enter a value for condition 1, or remove it.", "The start date must be on or before the end date.", "Choose at least one field.", "Remove the fields that are not in this lifecycle model." or "Remove 1 variable column to continue."
To change a connected control later, select it and press Replace connected data. The dialog reopens with your saved settings, fields and column order.
On a narrow window, Lifecycle data settings shows one pane at a time with a Settings | Preview switch, and Fields shows Available fields | Selected fields (N).
The Data preview
The right pane of Lifecycle data settings is titled Data preview. It shows:
- What one row is, for example "One row per lifecycle instance. Use the next step to choose which fields become report columns.", "One row per variable change of the chosen lifecycle instance." or "One row per declared variable in version 3.";
- The total, from the server, for example "25 lifecycle instances", "40 variable changes" or "13 variables". The preview reads at most the first 25 rows. When there are more, the line reads, for example, "Showing the first 25 of 1,284 lifecycle instances", and the pager pages over those 25 rows as "Rows 1–10", "Rows 11–20" and "Rows 21–25". When everything fits, the pager reads, for example, "1–10 of 25 results". A page length is never shown as the total, and the preview never shows example or dummy rows;
- The table, with the level's columns. Cells show what readers see: value states as their badges (for example Not reached) and coded values as words (for example "Running");
- Refresh, disabled with "Complete the settings to preview." while the settings are incomplete.
Only the newest request can fill the preview. While a newer one runs, the earlier rows stay dimmed under "Showing previous results. Updating…". A change that makes the settings incomplete or invalid sends no request and removes the earlier rows. Each other outcome has its own message (see Data preview messages), and none of them changes your settings.
The Fields step
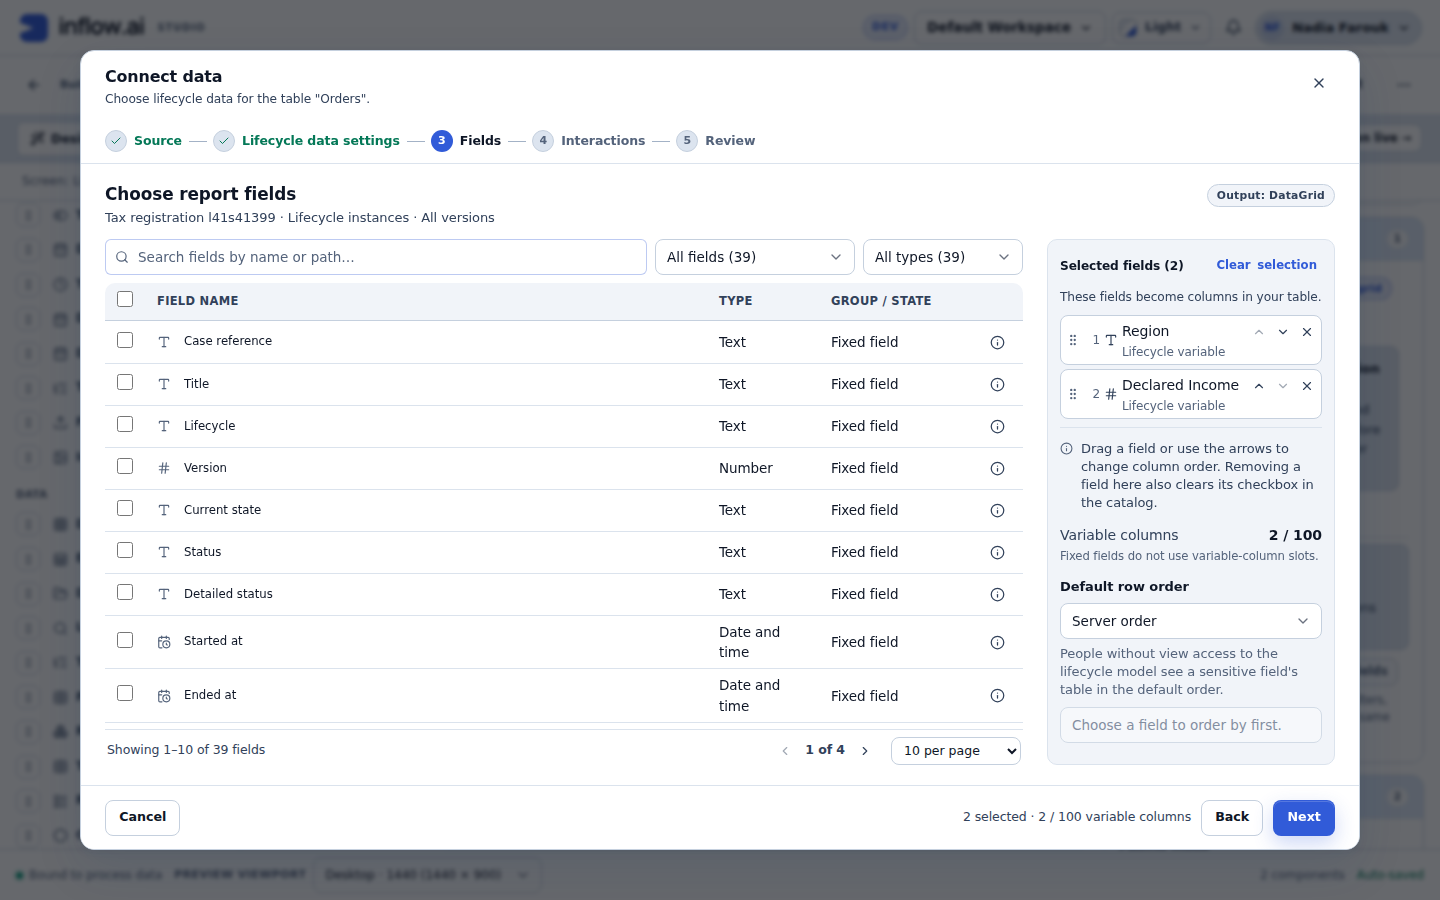
The Fields step is titled Choose report fields (DataGrid) or Choose chart fields (Chart). Under the title, a line names the model, the level and the versions, for example "Tax registration · Lifecycle instances · All versions", and a chip reads Output: DataGrid or Output: Chart. The step has two panes: the field list on the left, and Selected fields on the right.
The field list (left).
- One table, ten fields per page by default (the page-size choices stay available), in the model's order: fixed fields, counts, lifecycle variables, then each state in model order. The columns are a checkbox, Field name (with a lock and Sensitive for a sensitive variable), Type, Group / state, and a details button.
- Search fields by name or path… matches the label, the description, the technical path and the group or
state. The group filter offers All fields, Fixed fields and counts, Lifecycle variables and,
under States, one entry per state of the model, each with its count. The type filter offers All
types and only the types present, each with its count, for example "Text (12)". A search or filter goes
back to page 1 and never changes the selection. When nothing matches, the list reads
No fields match "{text}".with Clear search and Show all fields. - Only the checkbox selects. Pressing a field's name or its details button opens its details and never ticks or unticks it.
- The header checkbox, Select fields on this page, acts only on the fields shown on this page that can be ticked. It shows a mixed state when some of them are ticked. There is no "select all" across pages. The note under the table says: "The header checkbox selects eligible fields on this page only."
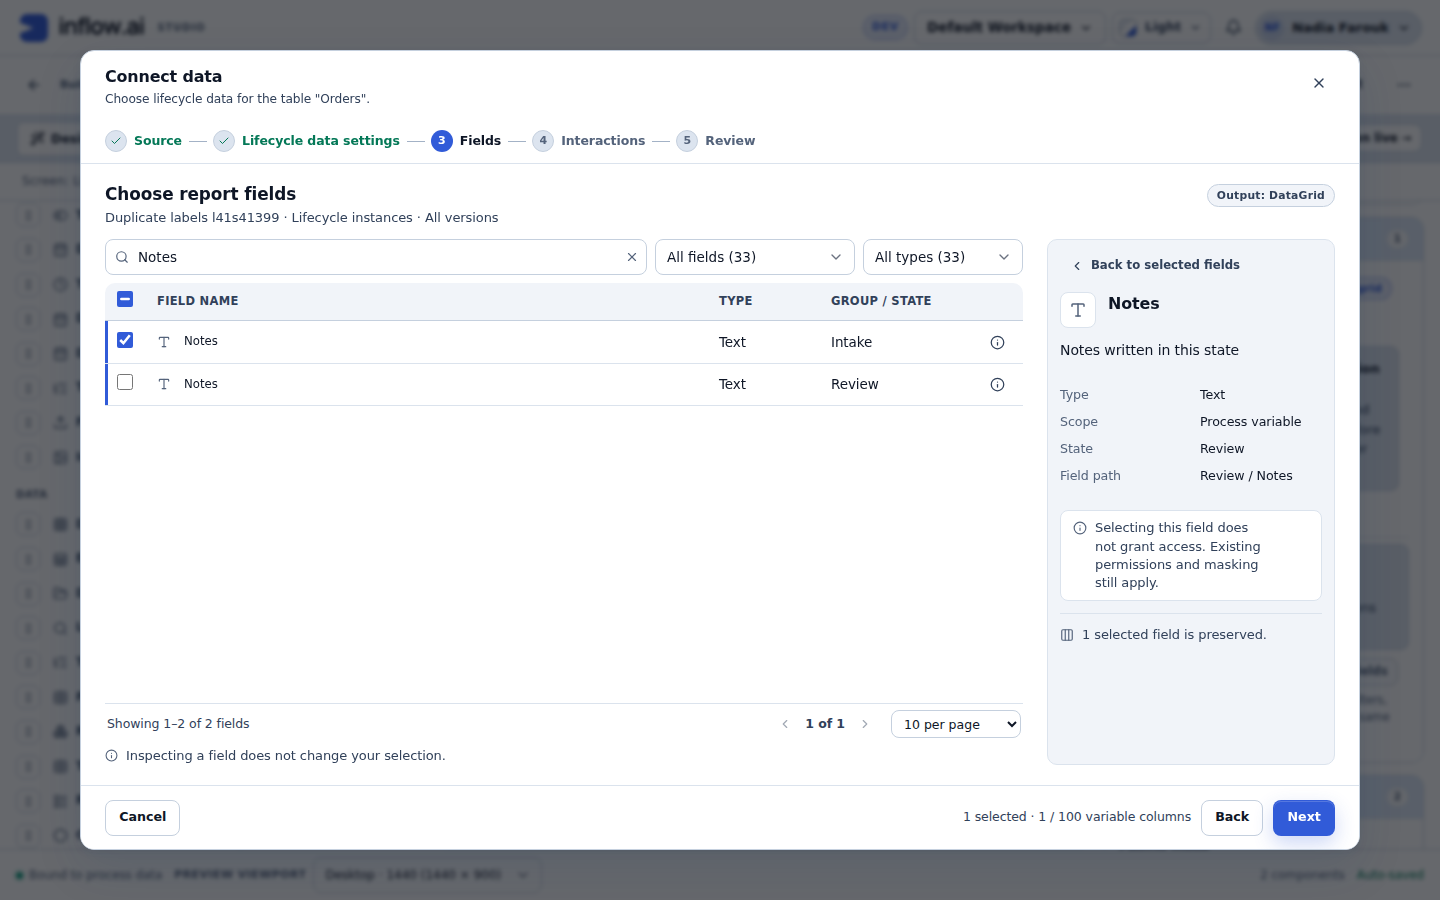
- Two fields with the same label in different states (for example "Notes" in Intake and in Review) are told apart by their state, and selecting one never selects the other.
Selected fields (right).
- The heading reads Selected fields (N). Fields are listed in the order you ticked them, numbered, with their type, their sensitivity and a second line naming the scope or path ("Lifecycle variable", "Fixed field", "Intake / Tax Id"). Long lists page separately, six per page (five in a short window).
- On a DataGrid, this order is the column order. Change it with Move up and Move down, with Alt+↑ and Alt+↓ on a focused field, or by dragging the grip handle. The handle also works from the keyboard: Space or Enter picks the field up, ↑ and ↓ move it (across pages), Space or Enter drops it and Esc cancels. The help line says: "Drag a field or use the arrows to change column order. Removing a field here also clears its checkbox in the catalog." When you reopen a connection, existing columns keep their formatting, header text and interactions; a newly ticked field is added at the end.
- On a Chart, there is no reordering. The explanation reads: "These fields are available to chart configuration. Inflow proposes a starting chart you can change in the chart settings." The order you tick fields in never decides the chart's category, series or value.
- Remove (or Delete on a focused field) removes one field and clears its checkbox; ticking it again adds it at the end.
- Clear selection empties the list at once. A notice "Selection cleared." with Undo removal stays for about 10 seconds; Undo brings back the fields in their order. Unticking the header checkbox works the same way ("3 fields removed." with Undo removal). The Undo ends early as soon as you change the selection again.
- The Variable columns block shows "{v} / 100", with the help "Fixed fields do not use variable-column slots." (see The 100 variable columns rule below).
- On a DataGrid, Default row order chooses the order the published table starts in: Server order (the default) or one of the selected fields, Ascending or Descending (disabled with "Choose a field to order by first." until a field is chosen). Its hint says: "People without view access to the lifecycle model see a sensitive field's table in the default order."
Field details. The details button (or the field's name) replaces Selected fields with the field's details: its label (and Sensitive when it is sensitive), Type, Scope (Fixed field, Count, Lifecycle variable or Process variable), State (for a process variable, the state whose state process declares it), Field path, the description written on the lifecycle model (or, when there is none, a plain sentence such as "Text variable of the Intake state process."), and for a count, Derived from (for example "Number of items in the Lines list."). Notes follow: "Selecting this field does not grant access. Existing permissions and masking still apply.", and for a sensitive variable "Sensitive variables show today's values only. Other dates show Value not recorded." No values are shown. Opening details never changes the selection; the footer of the details says, for example, "3 selected fields are preserved." Press ‹ Back to selected fields (or Esc) to return to the same page of the list.
Fields that cannot be columns.
- If the fields of a record type could not be loaded, that record variable is shown as a row that cannot be ticked, with "The fields of this record type could not be loaded." and one Retry above the list. The record is never offered as one single column instead.
- Record subfields are offered only when the lifecycle report can read them (SCRUM-2926). A Record offers the top-level fields its publication stored as privacy paths. A Record published with no privacy paths is one row named after the variable that cannot be ticked, with, for example, "Fields inside Customer aren't available as report columns yet."
- In Selected fields, an entry that the chosen lifecycle model does not have (for example after a model change, or a whole-record column saved earlier) reads Not in this lifecycle model, and a saved record field the report cannot serve reads Not available as a report column yet. Both still count, and Next stays disabled with "Remove the fields that are not in this lifecycle model." until you remove them. A saved record field whose record type could not be loaded reads "Fields of this record type could not be loaded"; it is kept and does not block you.
The 100 variable columns rule
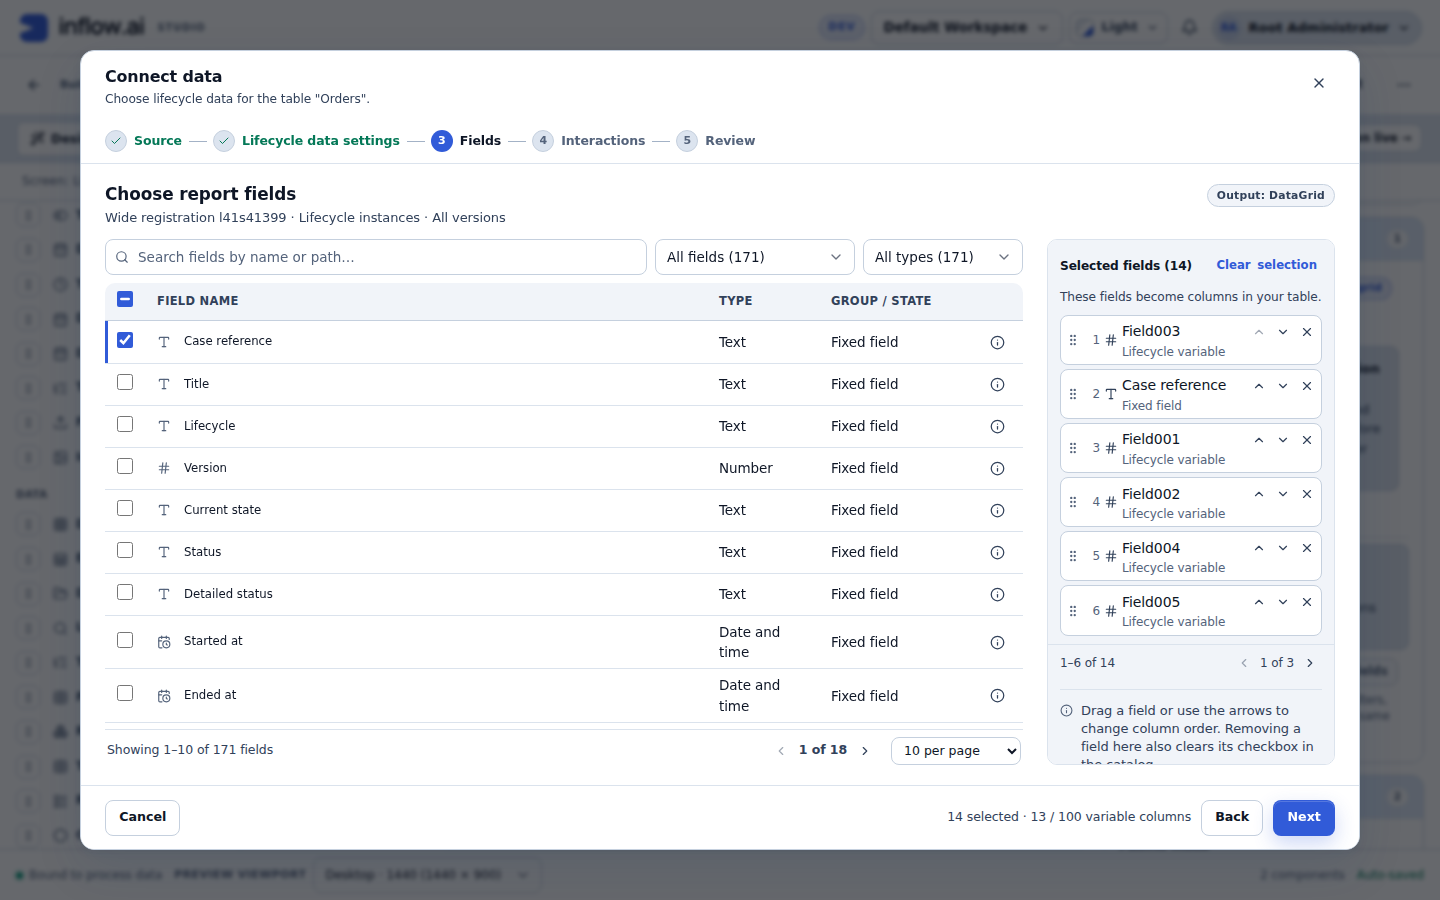
One control may show at most 100 variable columns. A variable column is any lifecycle variable, any process variable of a state, any record field, and a List's count (for example "Lines (count)"). Fixed fields (Case reference, Current state, Status…) and the instance counts (Tasks, Incidents, Reassignments…) never use a variable-column slot. The variables you choose at the Variable history level only decide which changes become rows, so they do not count either.
- The footer reads, for example, "14 selected · 13 / 100 variable columns", and the Variable columns block in Selected fields shows the same count.
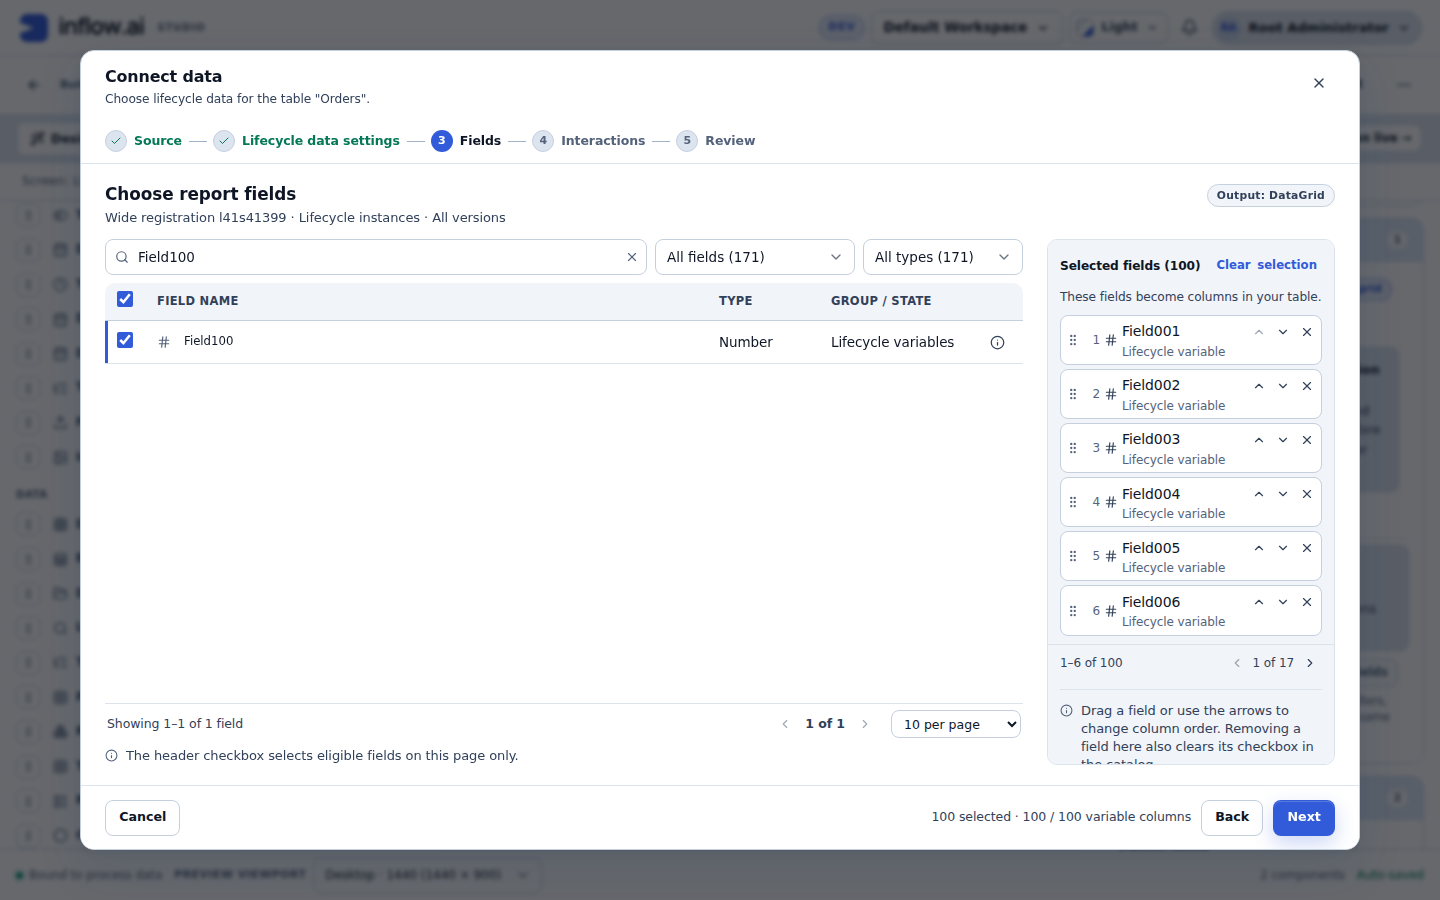
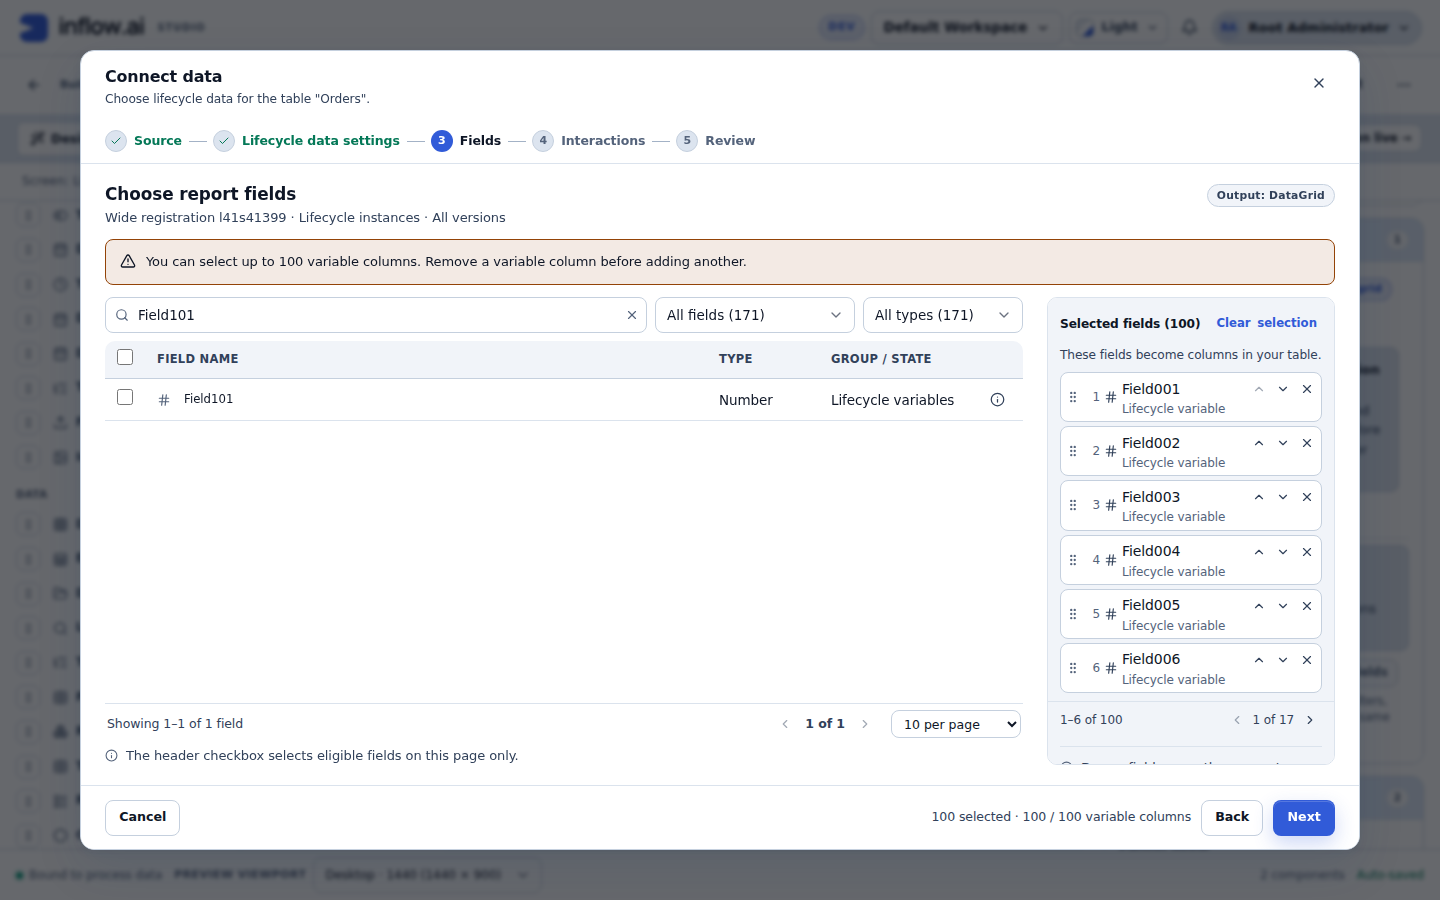
- At 100, ticking another variable is refused: its checkbox stays unticked and the alert reads "You can select up to 100 variable columns. Remove a variable column before adding another." A fixed field is still added.
- The header checkbox adds a page as a whole or not at all. If the page needs more slots than remain, nothing is added, not even its fixed fields, and the alert says how many new variable columns the page needs and how many remain, for example "These 3 fields need 3 new variable columns, and 2 remain. Nothing was added. Remove variable columns or select fewer fields."
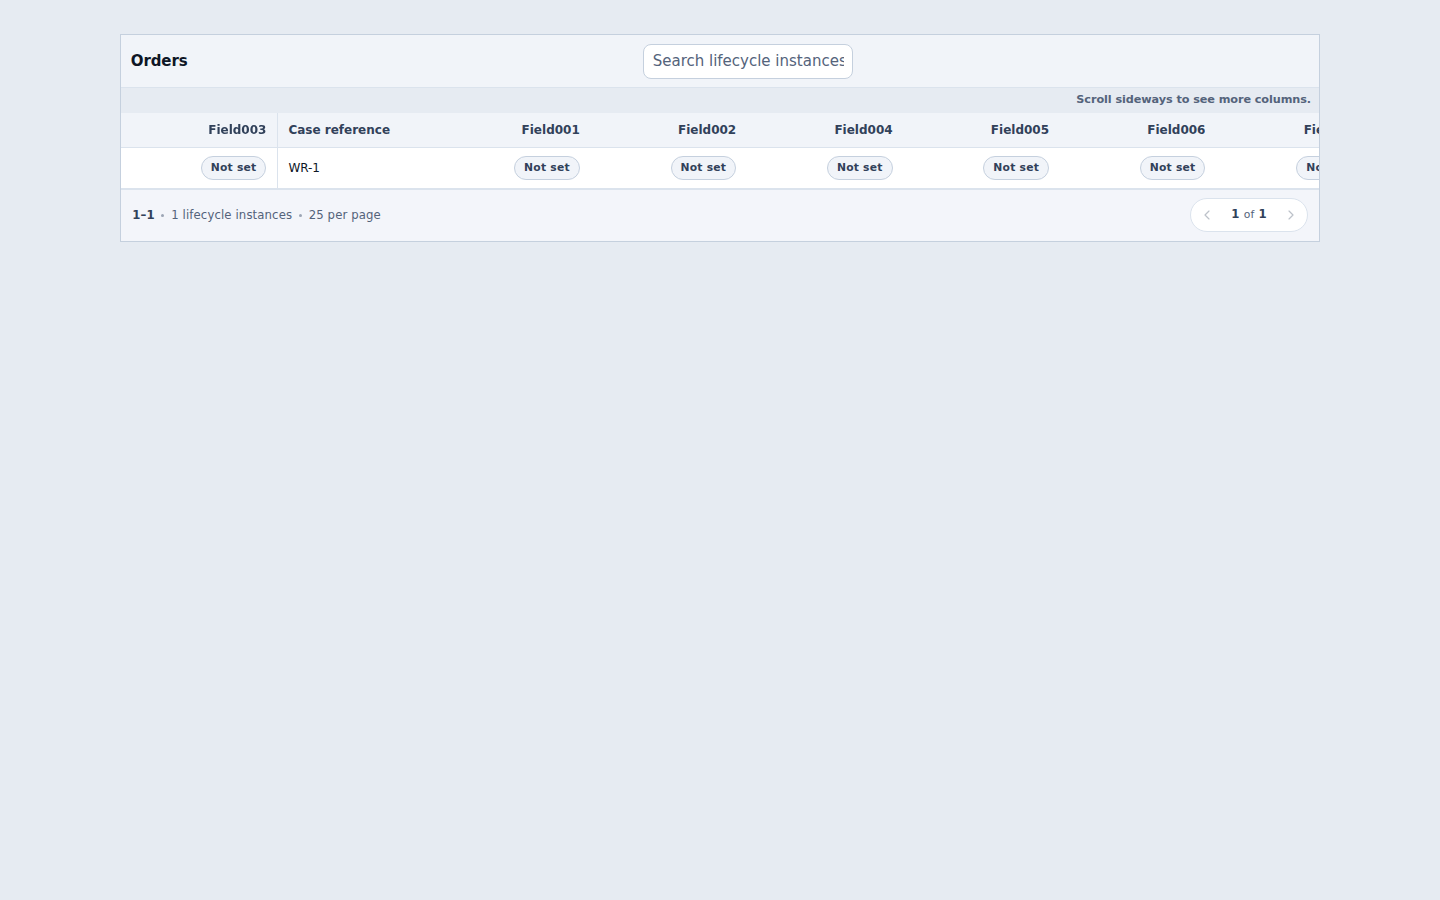
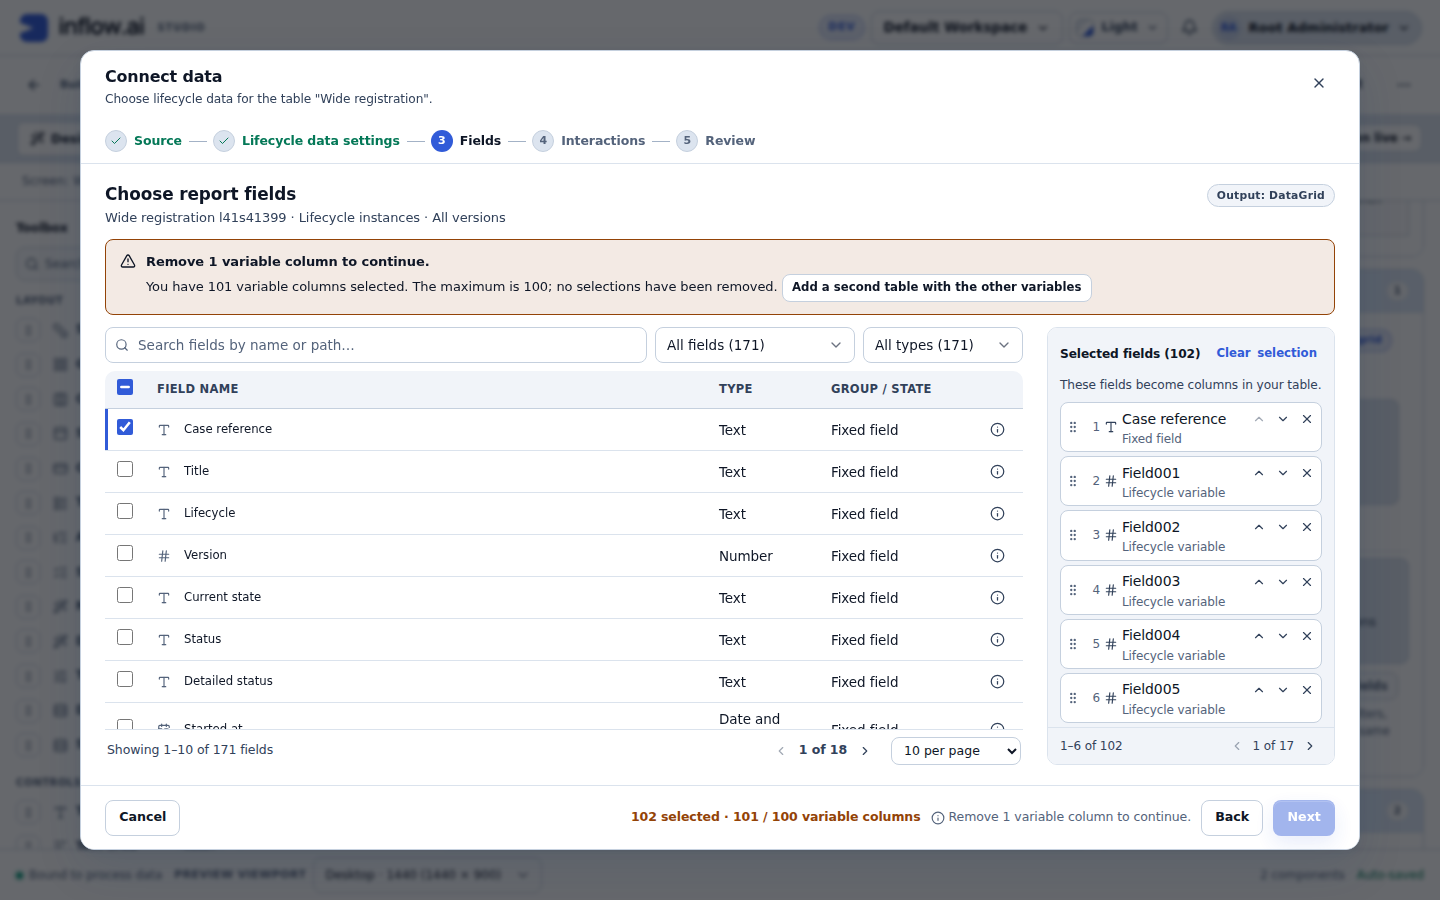
- A connection saved with more than 100 (for example before this rule was enforced in the dialog) opens unchanged: nothing is removed. A warning above the list reads "Remove 1 variable column to continue." (or the exact number), with "You have 101 variable columns selected. The maximum is 100; no selections have been removed." The footer shows 101 / 100, and Next is disabled with the same reason until you remove the excess. Remove, Back and Cancel stay available. On a DataGrid the warning also offers Add a second table with the other variables (see Showing more than 100 variables).
- The server checks the same rule when the page is saved and read.
Interactions and Review
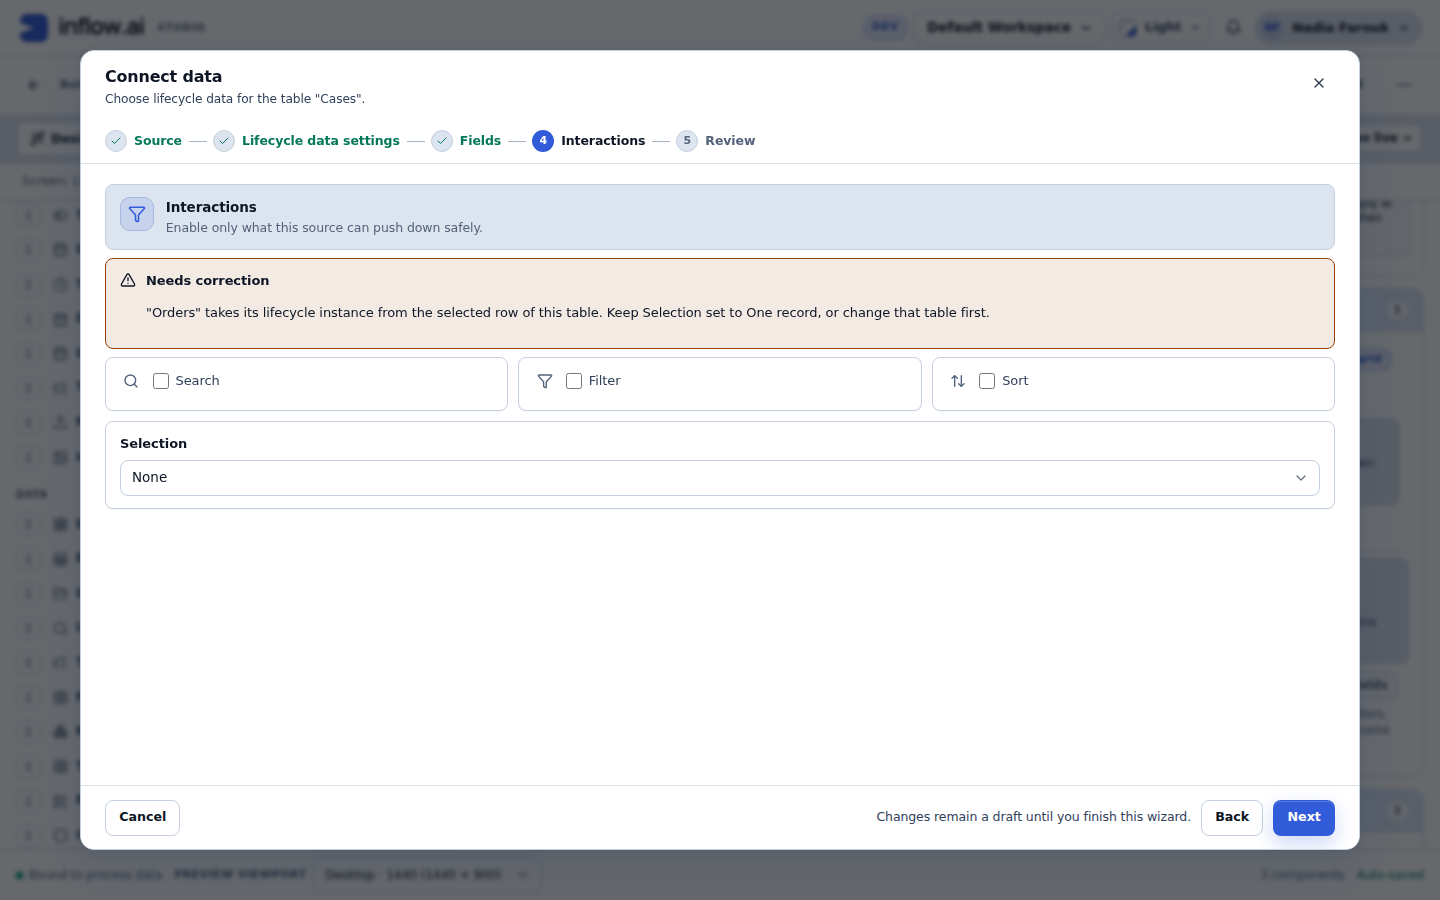
Interactions (DataGrid only) keeps its controls: Search, Filter, Sort and Selection. When
a change would break something that depends on this table, a Needs correction notice appears above them,
for example: "Case changes" takes its lifecycle instance from the selected row of this table. Keep Selection set to One record, or change that table first.
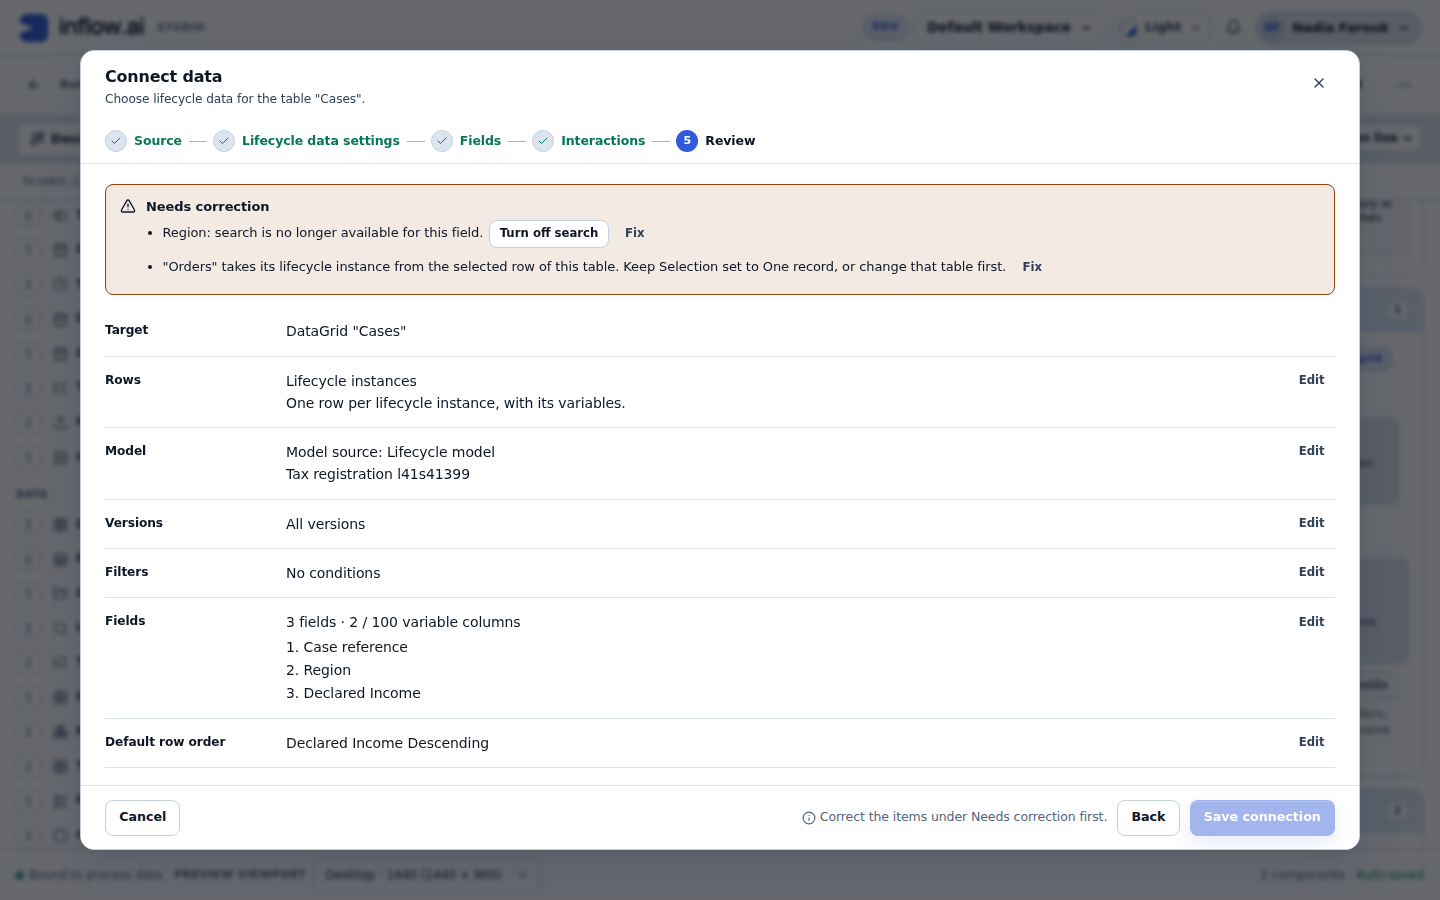
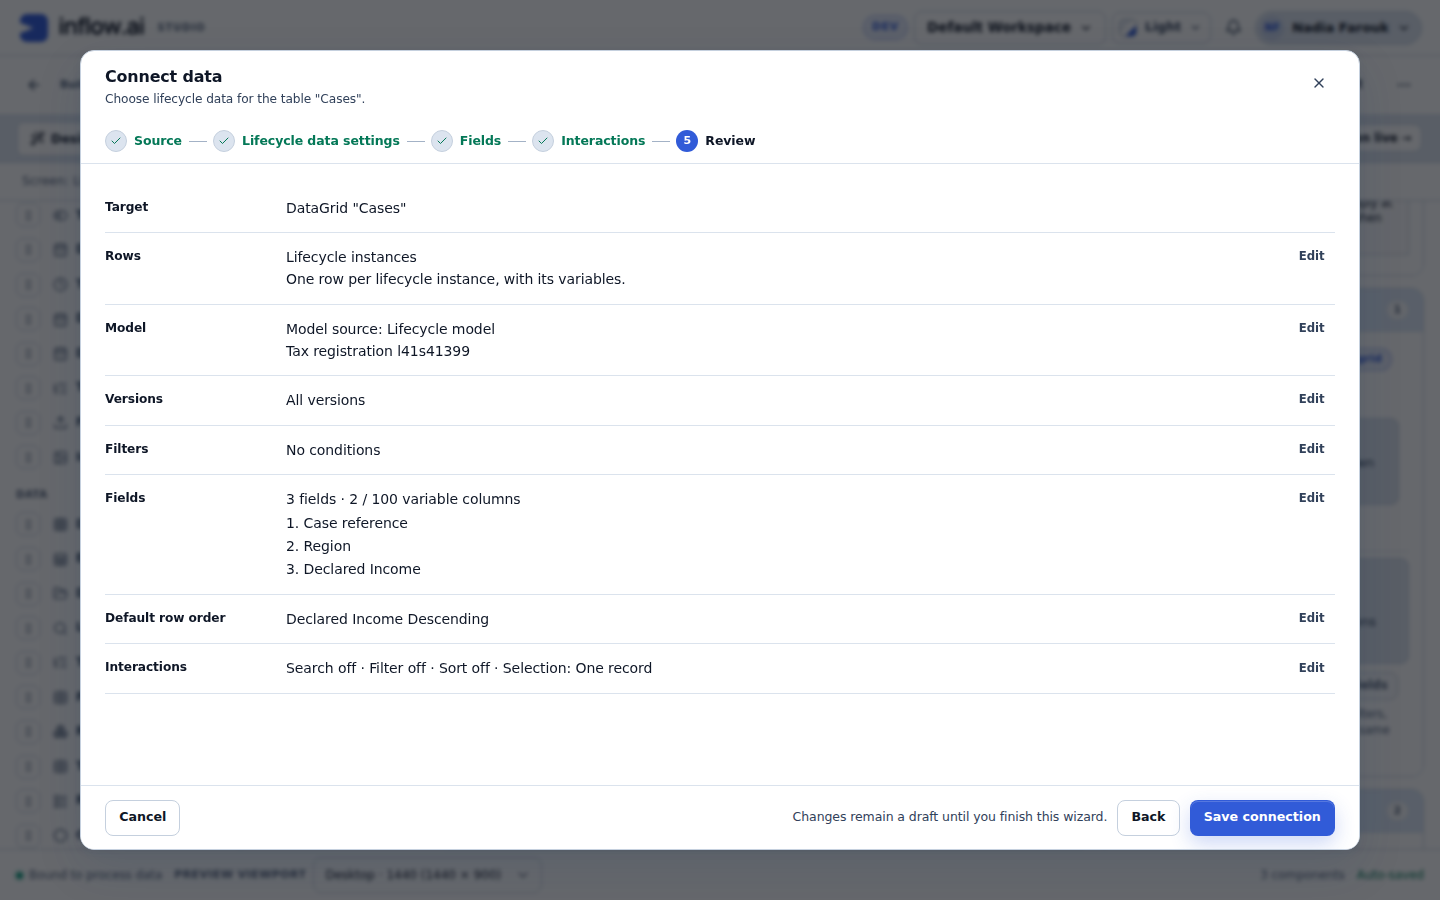
Review summarises the actual connection in words, never as configuration: Target (the control), Rows (the row meaning), Model ("Model source: …", the model, and for a dynamic source "Rows: …" and "Variables from: …", marked "(prefilled)" when it was prefilled), Versions, Filters (for example "Region is North", or "No conditions"), Dates (the history dates, or "Variable values as of …" with the As of sentence), Instance (with "Designer preview: … (not published)"), Fields (the count, then the numbered list; unnumbered on a Chart), Default row order, Interactions (for example "Search on · Filter off · Sort on · Selection: One record") and Limitations (for example the sensitive-value rule, a pending second table, or on a new Chart "Inflow proposes a starting chart you can change in the chart settings."). When you reopen a connection, Fields also lists "Removed columns:" and "Other columns kept:" where that applies. Each section except Target and Limitations has an Edit link that returns to its step with your draft intact.
If a change broke something, Review lists it under Needs correction, each with its own Fix link, and the finish button stays disabled with "Correct the items under Needs correction first." Nothing is dropped or rebound by name behind your back. Examples:
- "Default row order uses Declared Income, which is no longer selected."
- "Region: search is no longer available for this field." with Turn off search.
- "2 selected fields are not in this lifecycle model."
- On a Chart: "The chart's category uses Region, which is no longer selected." with the checkbox Start the chart mapping again from these fields.
Links to the dialog
The dialog can be opened from a link. While it is open, the page address carries ldNode (the control),
ldStep (source, settings, fields, interactions or review), ldLevel (instances, instance,
history or model), ldModel (picker, constant, page or expression), at the Lifecycle instance
level ldInstance (task, selected-row, page or expression), and on Fields, while a field's details are
open, ldField (the field id, for example var.intake.taxId). A reload or a shared link reopens that control
at that step with these choices. A link never skips a step whose Next is disabled: it opens at the first such
step, with its reason. A value that is not one of the choices, a disabled choice, or an unknown field is
ignored. A link never changes the selection. Cancel, Esc and finishing remove these parameters.
4. Choosing the lifecycle model
The Model source list has four methods. Pick the simplest one that does the job. Only the chosen method's controls are shown; if you switch to another method and back, what you entered is still there.
| Choice | When to use it | What is saved |
|---|---|---|
| A specific lifecycle model | The page always shows one lifecycle model. This is the usual choice. | The chosen model. The latest published version is always used. |
| Use a constant | Several pages should show the same lifecycle model, and you want to change it in one place. | The constant's name. The constant is read each time the page loads, so a change to the constant takes effect without republishing the page. |
| From this page | The page is opened with a lifecycle model, for example an App Shell page whose menu passes the chosen lifecycle model, or the page has a field or dashboard filter that names one. | The page input, form value or dashboard filter to read. |
| Advanced: write an expression | None of the above fits, for example you choose between two constants with a condition. | The expression text (at most 2,000 characters). |
From this page is the only method that can be unavailable. It then stays in the list, disabled, and a line under the list says why: "From this page is not available: This page has no input or value that can hold a lifecycle model."
A specific lifecycle model
Press Choose lifecycle model. The dialog lists the published lifecycle models you can view; type in Search lifecycle models to narrow it. Pick one and press Use lifecycle model. The Lifecycle model field then shows the model once, by name, with a Change link, and a muted line with its key and latest version, for example "Key tax-registration · latest version 3". Versions sits beside it (see Versions).
If the model is later retired, deleted, or no longer visible to you, the field keeps the reference (its key stays visible), reads "This lifecycle model is no longer available. Choose another lifecycle model.", and the link reads Choose another lifecycle model. Nothing is replaced for you.
If the list of lifecycle models cannot be loaded, the message "Could not load lifecycle models. Try again." appears under Model source with Retry; your choice is kept.
Use a constant
Choose Use a constant, then pick the constant in the Constant list. Each entry shows the constant's key and its lifecycle model, for example "salesLifecycle · Sales order". Only published constants of the type Lifecycle model are listed. If there are none, the hint reads "No Lifecycle model constants yet. Create one in Rules → Constants." Section 11 shows how. If the list cannot be loaded, it reads "Could not load constants. Try again." with Retry, and the chosen constant is kept.
When you pick the constant, Show variables of is set to the constant's current lifecycle model, with the note "Prefilled from the constant salesLifecycle. You can change it."
From this page
Use this when the page is opened with a lifecycle model, for example an App Shell page whose menu passes the lifecycle model the user picked. It takes three steps, with no code.
Take the lifecycle model from lists three kinds of page values:
- Page inputs of type LifecycleRef, shown as "Page input · <label>";
- Form values: another Select, ComboBox, Text or Hidden field on the page, shown as "Form value · <label>"; its value must be a lifecycle model or a lifecycle model key;
- Dashboard filters that hold one text value, shown as "Dashboard filter · <label>".
The steps below use a page input, which is the usual case.
- Give the page an input that holds a lifecycle model. In the designer, open the Inputs tab, add an input (for example "selectedLifecycle"), and set its type to LifecycleRef, which is the input type for a lifecycle model. Whatever opens the page (a menu, a link, another page) fills this input.
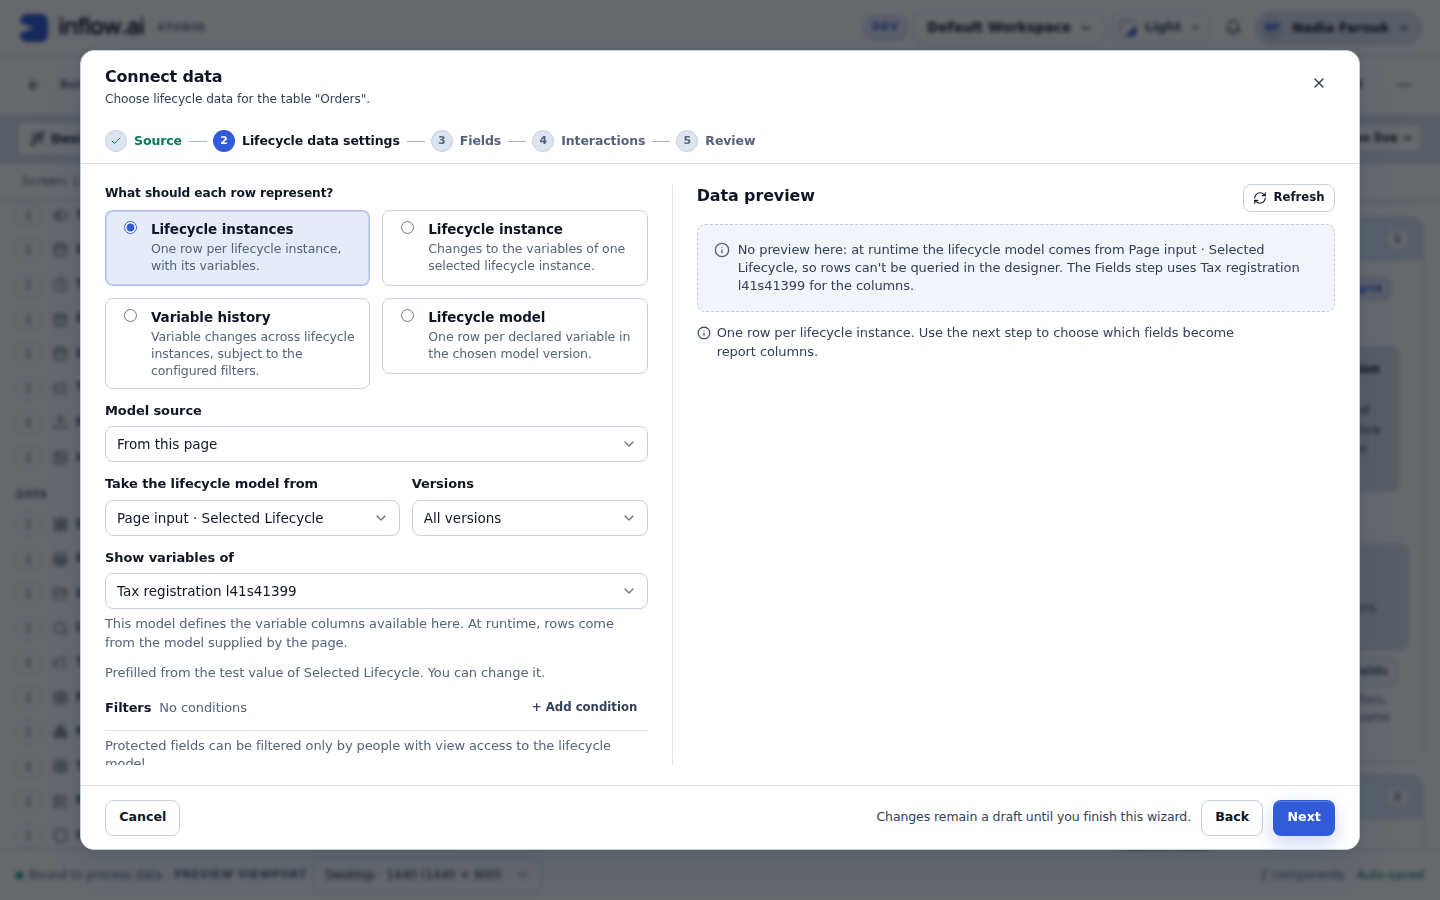
- Read it in Connect data. In Model source, choose From this page. In Take the lifecycle model from, pick the input, shown for example as "Page input · Selected lifecycle". If the page has no such input, form value or filter, From this page is disabled, and the line under Model source reads "From this page is not available: This page has no input or value that can hold a lifecycle model." Go back to step 1.
- Check "Show variables of". It is a separate control from Take the lifecycle model from: the first says where the rows come from at runtime, the second which model's variables you can choose as columns. If the input has a test value, and Show variables of is still empty, Studio fills it in with that lifecycle model and labels it "Prefilled from the test value of Selected lifecycle. You can change it." Keep it or pick another lifecycle model. If it is empty, pick the lifecycle model whose variables you want as columns. The Data preview cannot know the runtime model, so it asks for one instead of showing rows.
To give the input a test value: switch the designer to Live, open the Test values panel, choose a lifecycle model for the input and press Apply values. Without an applied test value, the input's default value is used.
Worked example: one App Shell page for whichever lifecycle model the menu passes
Goal: one page lists the lifecycle instances of whichever lifecycle model the user picked in the App Shell menu, with the right variable columns.
- Open the page in the designer. In the Inputs tab, add the input "selectedLifecycle" of type LifecycleRef. Make the menu item that opens this page pass the chosen lifecycle model into it.
- Switch to Live, open Test values, choose "Tax registration" for selectedLifecycle and press Apply values.
- Add a DataGrid and press Connect data. Choose the source Lifecycle data, then keep the tile Lifecycle instances.
- Under Model source, choose From this page. In Take the lifecycle model from, pick "Page input · Selected lifecycle".
- Show variables of already reads "Tax registration", labelled "Prefilled from the test value of Selected lifecycle. You can change it." Keep it. The Fields step will offer Tax registration's variables.
- Tick the fields, finish with Connect data, and publish. Review shows both: "Rows: Page input · Selected lifecycle" and "Variables from: Tax registration (prefilled)".
At runtime the table shows the lifecycle instances of the lifecycle model the menu passed. The fixed columns (Case reference, Current state, Status…) always work. A variable column that the passed lifecycle model does not have reads Not in this lifecycle model. If the page is opened without a lifecycle model, the table shows "The lifecycle model for this view could not be determined."
Advanced: write an expression
Most consultants never need this choice. Use it only when none of the other three choices fits, for example when the page should show one of two lifecycle models depending on a condition. An expression is a short formula, written in the same expression language as elsewhere in Studio.
Choose Advanced: write an expression and type it in Lifecycle model expression (its hint reads "For example inputs.selectedLifecycle or constants:salesLifecycle"), or press Edit expression to build it in the expression editor and then press Use expression. In the editor's suggestions, a Lifecycle model constant shows its model, for example "Lifecycle model · Sales order". Two common forms:
constants:salesLifecyclegives the lifecycle model held by the constant "salesLifecycle". Note the colon afterconstants.inputs.selectedLifecyclegives the lifecycle model in the page input "selectedLifecycle".
The result must be a lifecycle model, or the key of a lifecycle model as text (for example "sales-order").
Anything else, such as the key of a state process, makes the published control show "The lifecycle model for
this view could not be determined." A key that names no lifecycle model the reader can use (one that does not
exist, was retired or removed, or that the reader may not see) shows the neutral Not available state ("This is
not available to you", or "This chart isn't available to you." for a chart) with no Retry; it never says which of
these it is. The expression is worked out on the server when the page loads, as the
person reading the page, so it can never show them more than they may see. Every inputs.<name> the
expression reads is declared on the control when you finish Connect data, so the published page can supply it.
Show variables of
When the lifecycle model comes from a constant, this page or an expression, Studio cannot know at design time which lifecycle model will be shown. Show variables of answers that: it is the lifecycle model whose variables you want as columns. It is its own control, separate from the runtime source, and the note under it says, for a page value: "This model defines the variable columns available here. At runtime, rows come from the model supplied by the page." (for a constant or an expression, "…supplied by the constant." or "…supplied by the expression.").
It is often filled in for you, and a prefill is always labelled:
| Prefilled from | Note |
|---|---|
| the constant's current lifecycle model, when you use a constant | "Prefilled from the constant salesLifecycle. You can change it." |
| the page input's designer test value, when you take the model from this page and the test value names a lifecycle model | "Prefilled from the test value of Selected lifecycle. You can change it." |
| the lifecycle model you picked before with A specific lifecycle model | "Prefilled from the lifecycle model chosen before, Tax registration. You can change it." |
You can always change it; choosing another model removes the note. If it is empty, the step reads "Choose the lifecycle model whose variables you want as columns."
At runtime, if the lifecycle model actually shown does not declare a variable you mapped, that column reads Not in this lifecycle model. The fixed columns (Case reference, Current state, Status and so on) always work.
5. Level: Lifecycle instances
One row per lifecycle instance. This is the default level and the one most dashboards need.
When to use it
- A list of lifecycle instances with their current state, status and key variable values.
- A chart of lifecycle instances by current state, status, region or any other field.
- A master list on an App Shell page, whose selected row drives a second table (see section 6).
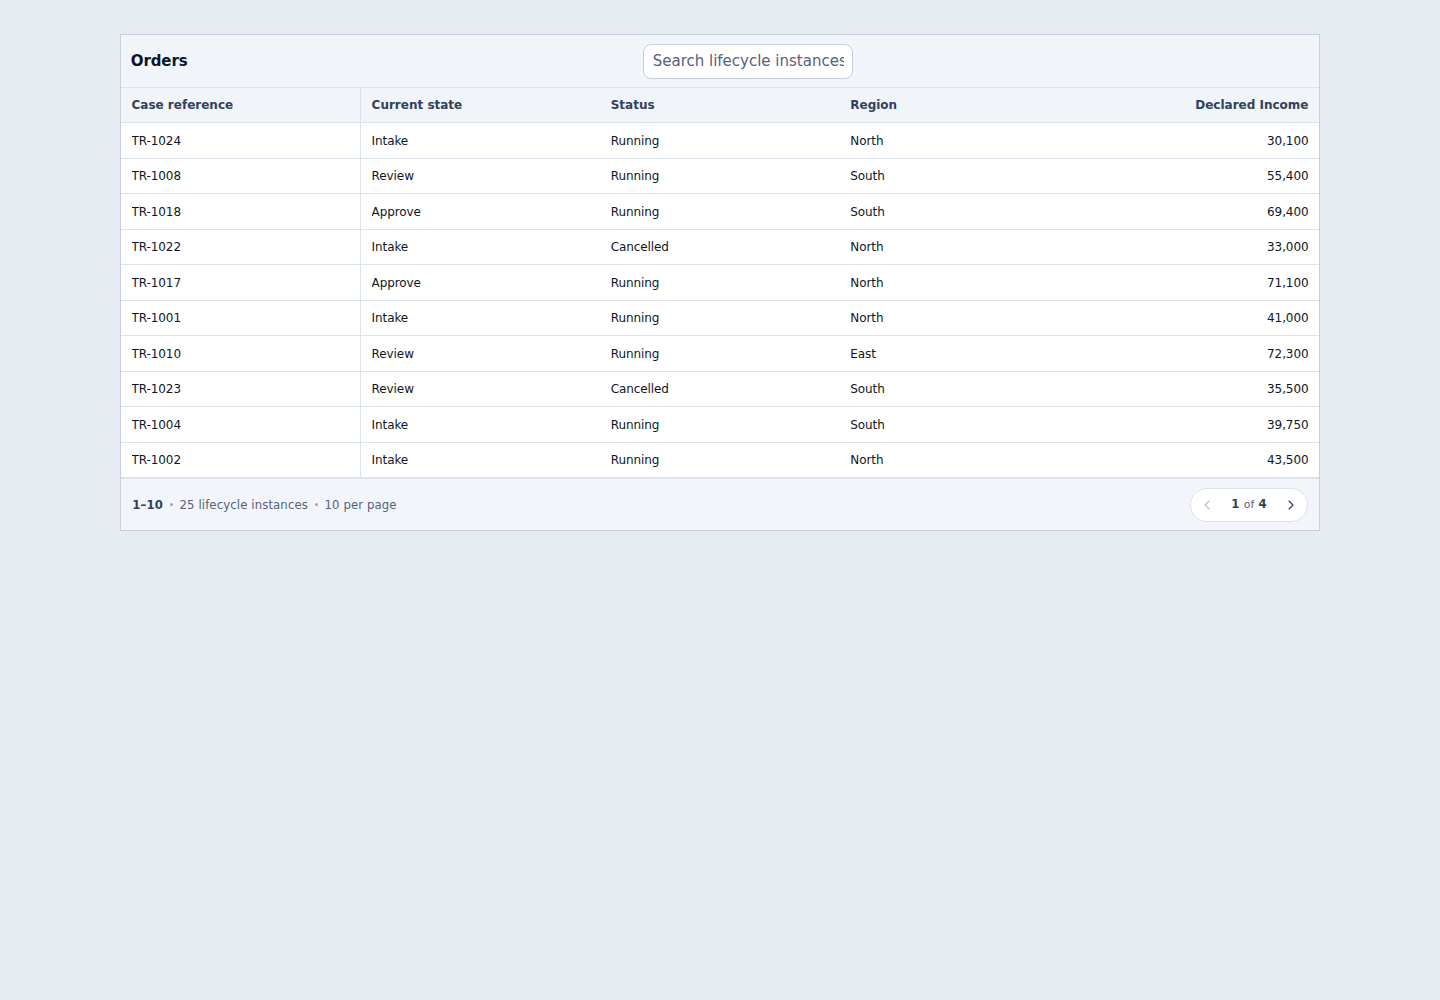
Worked example: a registrations table and chart
Goal: show every "Tax registration" lifecycle instance with its region and declared income, sortable as numbers, and chart how many are in each state, split by region.
- Drag a DataGrid onto the dashboard and press Connect data → category Lifecycle data → source Lifecycle data.
- Keep the tile Lifecycle instances.
- Model source: keep A specific lifecycle model, press Choose lifecycle model, pick "Tax registration" and press Use lifecycle model.
- Check the Data preview: it reads "Showing the first 25 of 1,284 lifecycle instances". Press Next.
- In Fields, tick Case reference, Current state and Status (group filter Fixed fields and counts), then Region and Declared Income (Lifecycle variables). Selected fields lists them in that order; move Region up if it should be the first column. Press Next through Interactions and Review, press Connect data, then publish.
- Open the dashboard. The grid pages through all 1,284 lifecycle instances ("1–25 of 1,284"). Sorting by Declared Income sorts numerically across all pages, not only the page you are on.
- Drag a Chart onto the dashboard and connect it the same way. Under Governed chart mapping, press Edit chart, choose Count records under How to aggregate, set Category to "Current state" and Series (optional) to "Region", and press Apply chart data. The bars add up to 1,284, and no "sample" note is shown. Lifecycle instances without a region are counted in a Not set group.
Options at this level
-
Versions, beside the model: "All versions" (the default), or some versions. See Versions.
-
Filters: filter conditions. With none, the row reads "No conditions". Press + Add condition, then choose a field, an operator and a value on one line; the remove button at the end of the line removes it. Operators: is, is not, contains, starts with, is greater than, is at least, is less than, is at most, is empty, is not empty. You can add up to 20 conditions (then + Add condition is disabled with "You can add up to 20 conditions."); all of them must match. Conditions run on the server before paging and chart totals. Until the lifecycle model is chosen, + Add condition is disabled with "Choose a lifecycle model first." A condition whose operator needs a value but has none stops Next and the preview with "Enter a value for condition 1, or remove it." When a protected field is offered, the help under the row says "Protected fields can be filtered only by people with view access to the lifecycle model." The value:
- Status, Scope and Origin are chosen from a list in business words (Running, Completed, Cancelled; Lifecycle variable, Process variable; Produced by a step, …). The page stores the code.
- Current state takes a state name, for example "Review" (an exact match first, otherwise ignoring case).
- Numbers are typed as numbers, Yes/No as
trueorfalse, and dates asYYYY-MM-DD.
Example: Status is Running, and Region is North.
-
Show variable values as of a date (As of): see section 9.
The fields
The Fields step offers the fields below. The group filter names them Fixed fields and counts, Lifecycle variables and one entry per state; the published column headers use the labels shown here.
Lifecycle instance (fixed fields):
| Field | What it shows |
|---|---|
| Case reference | The lifecycle instance's reference. |
| Title | The lifecycle instance's title. |
| Lifecycle | The lifecycle model's name. |
| Version | The version of the lifecycle model the instance runs. |
| Current state | The last state entered. An ended lifecycle instance shows the state it ended in. |
| Status | Running (running or paused), Completed, or Cancelled (cancelled, stopped or failed). |
| Detailed status | The engine status in business words: Running, Paused, Completed, Cancelled, Stopped, Failed. |
| Started at / Ended at | When the lifecycle instance started and ended. |
| Duration | From start to end, or to now while it runs (to the As of day under As of). Shown as a duration, for example "3 days 4 hr". |
| Duration (business) | The same span counted in business time: only the working hours of the connection's business calendar (section 22). |
| Finished | Yes when the lifecycle instance has ended (completed, cancelled, stopped or failed), No while it runs. Filter Finished is Yes to average only lifecycle instances that are done; Duration of a running one keeps counting to now. |
| Business cycle time | The same value as Duration (business). The field keeps its old name and id. |
| Age bucket | Duration grouped as <1d, 1-7d, 7-30d or >30d. |
| Started by | The person who started it. |
| Parent lifecycle instance | The lifecycle instance that started this one, shown only when you can see the parent. |
| SLA target | The case service level of the lifecycle instance's version: how long a case should take (spec 124). Set in the lifecycle designer (Bindings › Service level). Not set when the version has none. |
| SLA deadline | When the target is reached: start plus the target, in working time of the service level's own calendar (or in wall time for a calendar-time target). Not set without a service level, or when the calendar gives no working time within a year of the start (SLA at risk and SLA breached are still shown then: they compare the time worked so far with the target). When the case started before the calendar's generated range it cannot be measured: the deadline, SLA at risk and SLA breached are all Not set. An SLA target is shown in hours and minutes, never days (for a business-time level it is working time). |
| SLA at risk | Yes while the lifecycle instance is open, not breached, and at least the at-risk share (default 80%) of the target has passed. No once it ends. Not set without a service level, never No. |
| SLA breached | Yes when more time than the target has passed — up to now while it runs, up to its end once it ended (then it never changes), cancelled and failed cases included (the Live view shows those as Ended). Not set without a service level, and when the case cannot be measured (its start is before the calendar's generated range). |
| Outcome | The name of the terminal state a completed lifecycle instance ended in. Not set for a running, cancelled or failed one. |
| Cancellation reason | The reason given when a cancelled lifecycle instance was cancelled, as written. When the platform cancelled it itself (for example while its process model was being deleted), it reads Cancelled by the system. Not set without a reason. |
The SLA fields measure business time with the service level's own calendar (else the workspace's default), never the connection's Business calendar setting, which applies to the business-time fields only. Under As of they are measured up to that day, and Outcome and Cancellation reason show only for lifecycle instances that had ended by then. A lifecycle instance running its own case-specific design follows the service level of the version that design was based on. They filter, sort and chart on the server like every other fixed field. Because they are computed when you read them, editing a business calendar changes the SLA verdicts of past lifecycle instances, as it changes their business durations.
The cost fields Total cost and Cost complete were removed on 2026-10-08, with process costing (spec 108). A page saved with one of them still opens: a column, filter or sort that named it is left out.
Counts: Reassignments, Rework, Incidents, Open incidents, Tasks, Active tasks, Completed tasks, Overdue tasks. Task and incident counts include the work of every state of the lifecycle instance. Overdue tasks counts the tasks that are open past their deadline adjusted for SLA pauses, plus the tasks completed after it; cancelled, expired and failed tasks never count (SCRUM-4639, the rule of the task list's "Overdue only"). Reassignments and Rework are calculated live from the lifecycle instance's own records:
- Rework counts the visits beyond the first to each state, added up over the states. A lifecycle instance that went Intake → Review → Intake → Review has Rework 2. A retry of a state after the lifecycle instance failed in it is not a new visit: the visit continues, so a retry never counts as Rework.
- Reassignments counts every hand-off of its tasks: a move to another person and a release back to the pool. It equals, over the lifecycle instance's tasks, the Tasks level's Reassignments plus Releases (section 20), because the Tasks level counts the two separately.
Time in states (only when you add them): five columns per state, for example "Time in Review". See section 21.
Lifecycle variables: one field per lifecycle variable, labelled with its label, for example "Region ·
Text" or "Declared Income · Number". A variable's label is made from its name: declaredIncome becomes
"Declared Income" and taxId becomes "Tax Id". This is the same label Operate shows.
One group per state (for example "Intake", "Review", "Approve"): one field per process variable of that state, labelled "<State> › <Label>", for example "Intake › Claude Loves To Eat Tokens · Number".
How variables become fields:
- Types: Text, Number, Yes/No, Date, Date and time, Person and File keep their type. Values are formatted in the reader's language (numbers, dates). Sorting, filtering and chart groups use the type too: numbers sort as numbers, and Date and Date and time variables sort, filter and group as dates.
- Record variables with a published record type offer one field per record field that the lifecycle report can serve, for example "Customer › Name" and "Customer › National ID". A lifecycle-level Record uses the privacy paths its publication stored (SCRUM-2926). A Record published with no privacy paths appears as one row that cannot be ticked, with "Fields inside Customer aren't available as report columns yet." A Record is never offered as one single column.
- Record variables without a record type, and structured "Any" values, are one field shown as Protected for every reader. The field list says "Shown as Protected: this value has no governed shape."
- List variables give a count, for example "Lines (count)" of type Number.
- A process variable shows the value from the latest run of its state. A lifecycle instance that never reached that state shows Not reached, with the hint "This lifecycle instance has not been in Intake yet."
- A lifecycle instance on an older version that lacks a variable shows Not in this version.
- A variable that was retyped in a later version uses the latest type. A value that does not fit is shown as text.
The footer and the Variable columns block show how many variable columns you have selected, for example "12 / 100 variable columns". One control may have at most 100: see The 100 variable columns rule for what counts.
Fields that are only identifiers (the lifecycle instance id, the lifecycle model key) are not offered as columns. The lifecycle instance id travels with every row, so selection and the Lifecycle instance level still work.
6. Level: Lifecycle instance
One lifecycle instance's changes. By default there is one row per recorded change to a variable of that lifecycle instance, newest first. With Current values on, there is one row per variable instead.
When to use it
- On a task form, so the assignee sees what changed in the lifecycle instance before their task.
- In a master-detail page: a Lifecycle instances table on the left, and the selected lifecycle instance's changes on the right.
- On a page opened with a lifecycle instance, for example from a link.
Which lifecycle instance? (the instance input)
Under "Which lifecycle instance?" pick one of four choices. Every choice stays listed; a choice that does not apply on this page is disabled and shows its reason.
| Choice | When it applies | Notes |
|---|---|---|
| This task's lifecycle instance | Task forms only | Preselected on task forms. Elsewhere it is disabled with "Only available on task forms." A task belongs to a state's work, and Inflow resolves it to its lifecycle instance, so you see the changes of every state, not only the current one. |
| Selected row of another table | Pages with a Lifecycle data DataGrid at the Lifecycle instances level | Preselected when the page has exactly one such table. Pick the table under Table, for example "Instances table (Lifecycle instances)". That table must let readers select one row (Interactions → Selection → One record). If it does not, Connect data says "“Orders” doesn't let people select a row, so this table would stay empty." and offers one click, Let people select one row in “Orders”. Review then lists it under Also changes ("“Orders” › Selection → One row"), and Finish applies it together with this table as one change (one Undo). Nothing changes on the other table before Finish; Keep “Orders” as it is drops the plan, and finishing is never blocked by it (SCRUM-4601). Finish sets that table exactly as choosing Single under its Selection mode would. The offer is made only when that table's Selection is None; for a table set to Multiple, or where Connect data cannot change another control, the Table hint reads "Set this table to let people select one row, so its selected lifecycle instance reaches this table." With no such table the choice is disabled with "Add a table at the Lifecycle instances level first." |
| From this page | Pages with a value that holds a lifecycle instance, state process instance or task id | Pick it under Take the lifecycle instance from: a page input of type Text or Uuid ("Page input · <label>"), or another Select, ComboBox, Text or Hidden field ("Form value · <label>"). With none, the choice is disabled with "This page has no input or value that can name a lifecycle instance." |
| Advanced: write an expression | Anything else | Type it in Lifecycle instance expression. It may name a lifecycle instance, one of its state process instances, or a task, for example inputs.taskId. |
When the input names nothing, or a lifecycle instance the reader cannot see, the control shows "Choose a lifecycle instance to see its changes." and no rows.
Preview with (sample instance)
Because the real instance is only known at runtime, the designer asks for a sample to preview. It sits under its own subheading, Designer preview, apart from the settings that are published, with the note "Used only for the Designer preview. This sample is not published." Under Preview with (it reads "No instance chosen" until you pick one), press Choose an instance, type in Search lifecycle instances (each entry shows, for example, "TR-1042 · Review · Running") and press Preview with this instance. The search runs on the server over every lifecycle instance you can see and lists up to 25 matches. The button is disabled with "Choose a lifecycle model first." until a lifecycle model is set (for a constant, this page or an expression, through Show variables of). If nothing matches, the dialog reads "No lifecycle instances to preview yet." If the search fails, it reads "Could not search lifecycle instances. Try again." Review shows the sample as "Designer preview: … (not published)", and the published connection never contains it.
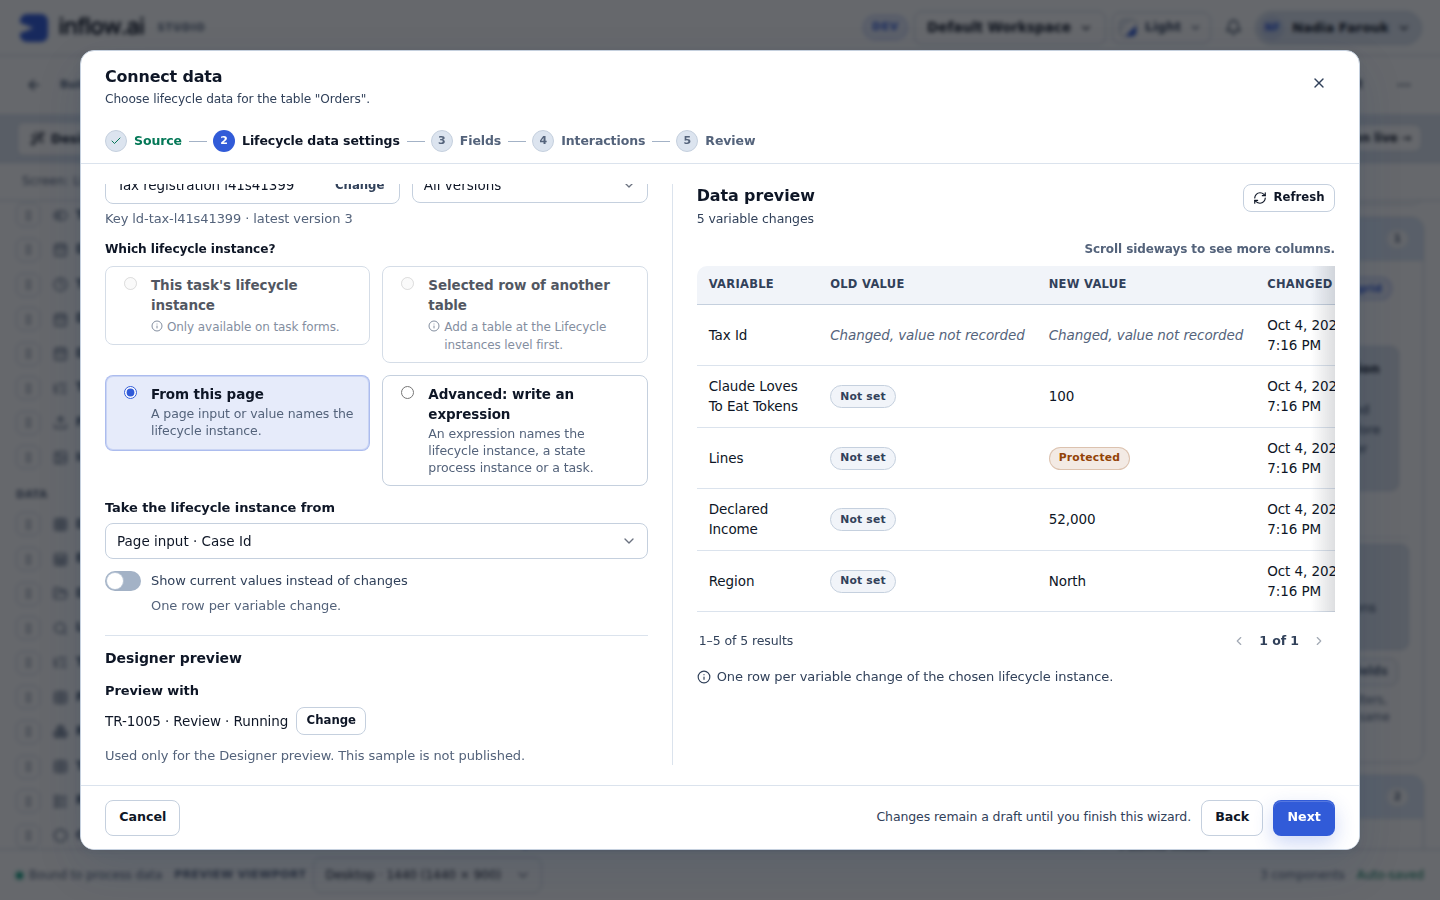
Worked example: the case history on a Review task form
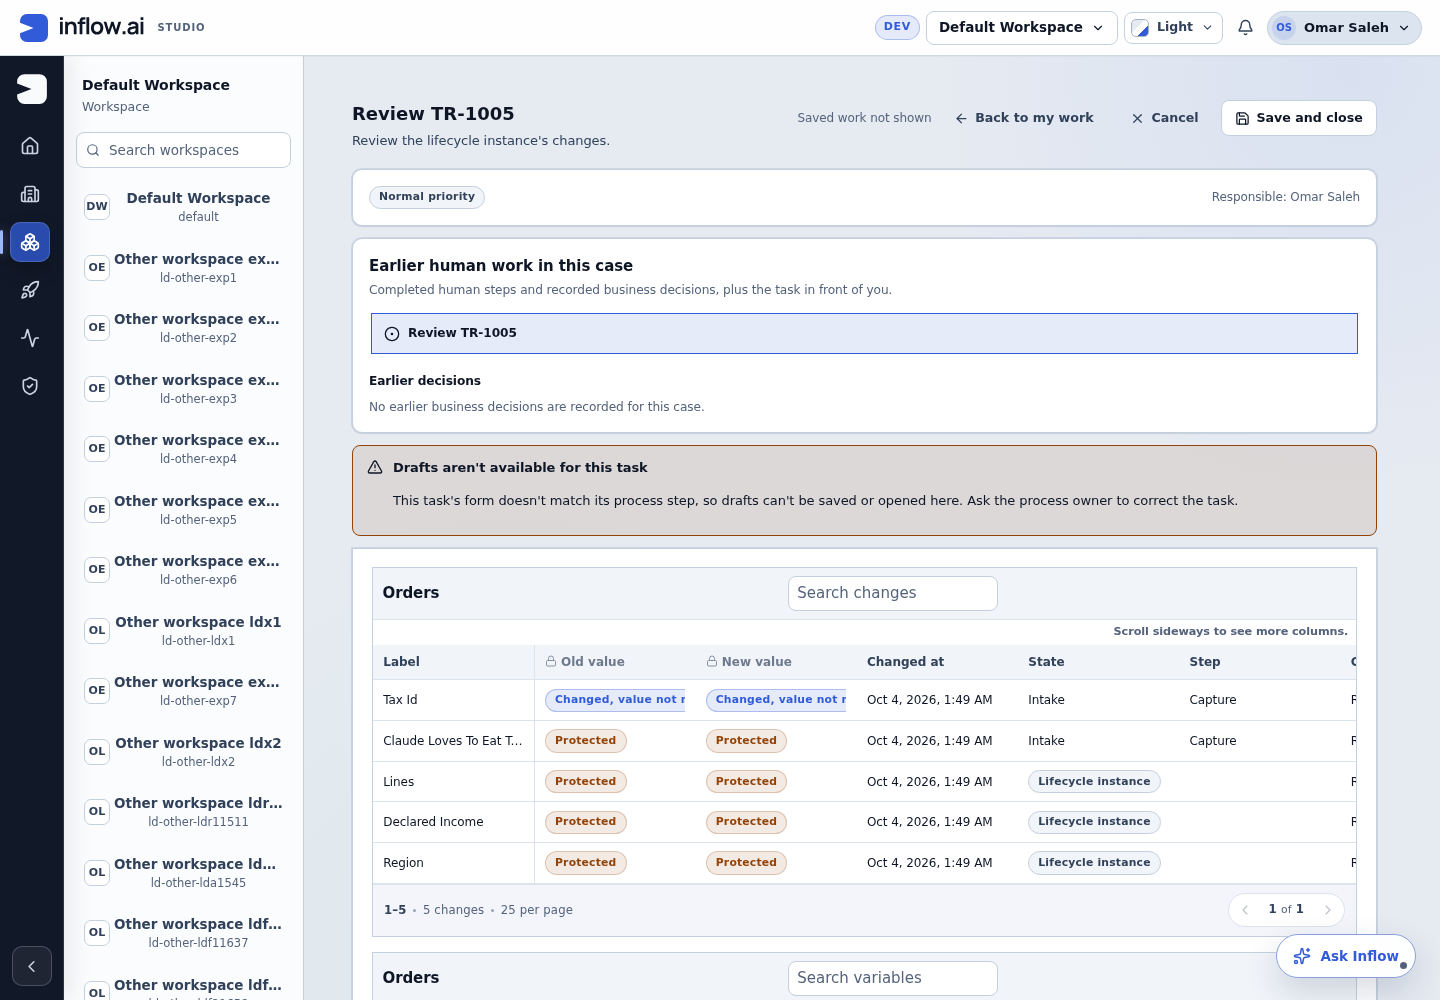
Goal: while doing the Review task, the reviewer sees every change to the lifecycle instance's variables.
- Open the Review task form in the designer. Drag a DataGrid onto it and press Connect data → Lifecycle data.
- Choose the tile Lifecycle instance.
- Model source: A specific lifecycle model → Choose lifecycle model → "Tax registration".
- Which lifecycle instance? is already This task's lifecycle instance.
- Designer preview → Preview with: choose "TR-1042 · Review · Running". The Data preview reads "40 variable changes", newest first.
- Press Next, tick Variable, Old value, New value, Changed at, State, Step, Changed by and Origin, and press Next until Review, then Connect data. Publish the form.
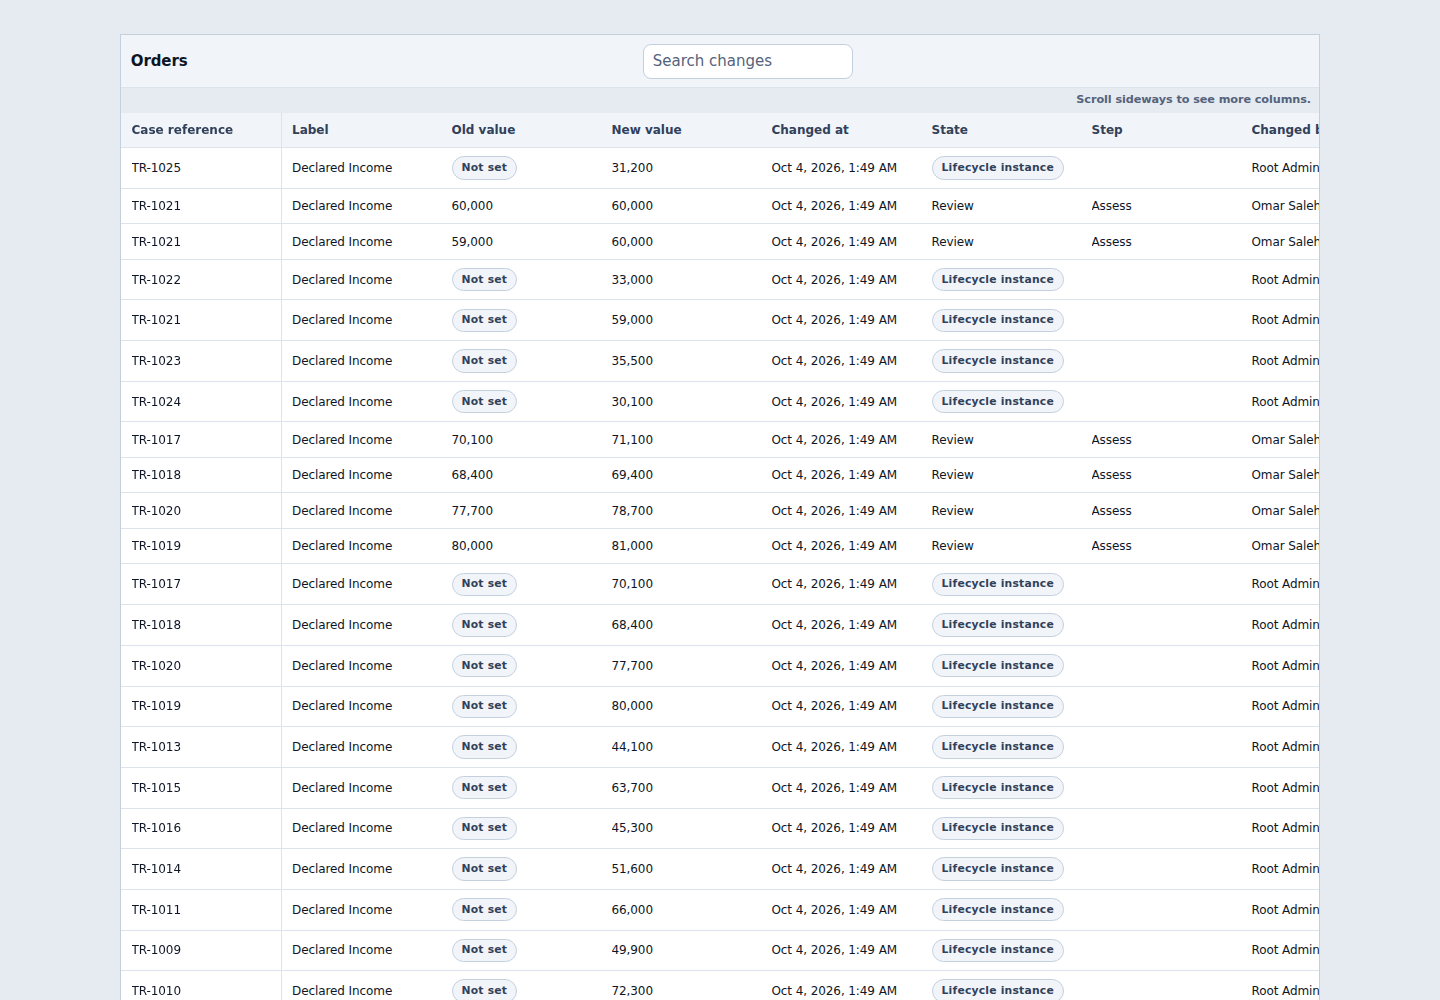
At runtime, every Review task shows its own lifecycle instance's changes. A change written at the step "Assess" of the Review state reads State "Review", Step "Assess" and Origin "Produced by Assess".
Change fields (default)
| Field | What it shows |
|---|---|
| Variable / Label | The variable's name and its label. |
| Scope | Lifecycle variable or Process variable. |
| State › Step | Where the change was made: the state and the step (two fields, State and Step; the designer preview shows them as one column, "Intake › Capture"). A change made at the start or by an operator on the lifecycle instance itself shows "Lifecycle instance" in State, with the hint "Changed outside a state". |
| Old value / New value | The value before and after. Not set when there was no value. For a sensitive variable, both read Changed, value not recorded for every reader. |
| Changed at | When the change was recorded. |
| Changed by | The person, or System. |
| Origin | How the value arrived, in business words (see below). |
| Sensitive | Yes when the variable is declared sensitive. |
Origins: "Set when the lifecycle instance started", "Produced by <step>", "Submitted at <step>", "Carried by an incoming signal", "Repaired by an operator", "Combined from parallel branches", "Recorded by the engine", "Source not recorded". In a chart grouped by Origin, the step is not named: the groups read "Produced by a step" and "Submitted at a step".
The changes are always shown newest first. Readers can sort only by Changed at (newest first), and this level has no Filters row.
Changes made inside a sub-process that a state calls appear once, as a change at the calling step. Their internal steps belong to that sub-process's own instance.
Current values
The switch Show current values instead of changes says what a row is: off, "One row per variable change."; on, "One row per variable with its current value." Switch it on, and there is one row per declared variable, with Value, Last changed at and Last changed by (plus Variable, Label, Scope, State and Sensitive). A process variable shows the value from the latest run of its state, or Not reached. A Record variable is one row whose value reads Protected for every reader.
A common design is two grids on the same task form: one with the changes and one with Current values.
Worked example: master-detail on an App Shell page
- The page already has a DataGrid "Instances table" at the Lifecycle instances level, with Selection set to One record in its Interactions step.
- Add a second DataGrid → Connect data → Lifecycle data → tile Lifecycle instance → "Tax registration".
- Which lifecycle instance? already shows Selected row of another table with "Instances table (Lifecycle instances)", because it is the only such table on the page.
- Under Designer preview, Preview with "TR-1001", then Next, tick the fields, and finish with Connect data. Publish.
If you later change the first table so that it no longer lets readers select one row, or no longer lists
lifecycle instances, its Interactions step and Review show Needs correction with
"Case changes" takes its lifecycle instance from the selected row of this table. (see
Interactions and Review).
5. On the published page, clicking a row in the first grid shows that lifecycle instance's changes in the
second.
7. Level: Variable history
Every recorded change across all lifecycle instances of the lifecycle model that the reader can see, newest first. Each row has the change fields of section 6 plus Case reference and Version (group "Lifecycle instance").
When to use it
- An audit view: "every change to Declared Income in the last 90 days".
- A review of who changed a sensitive variable, and when and where (never its value).
Options
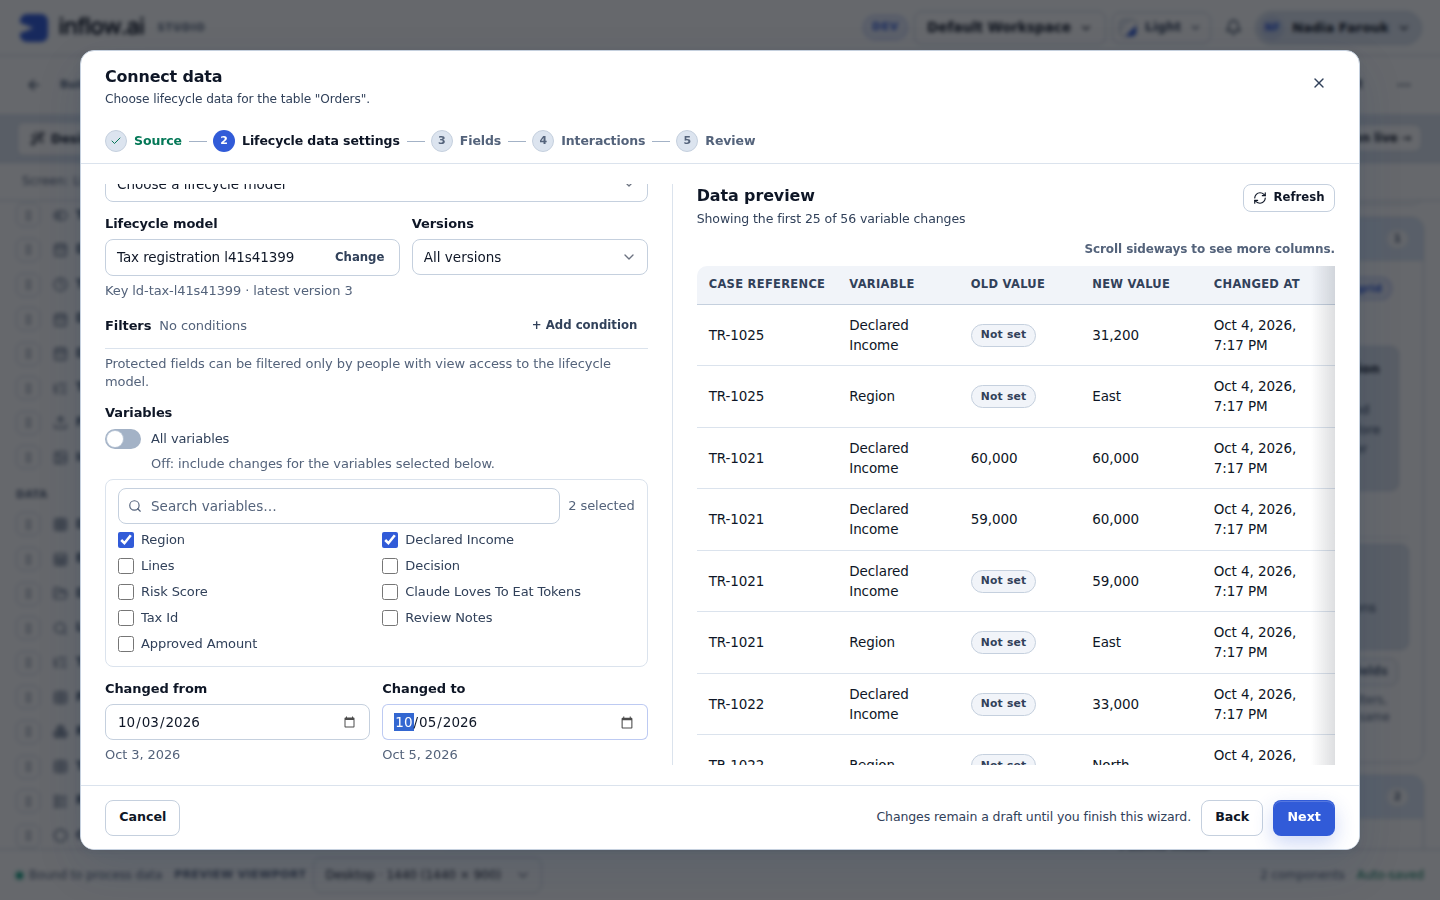
- All variables: a switch, on by default ("On: include changes for every variable of the model."). Switch it off to choose variables ("Off: include changes for the variables selected below."): search with Search variables…, tick the variables in the two-column list, and the count reads, for example, "2 selected". For screen readers, each variable is described by its kind: "Process variable of the Intake state" or "Lifecycle variable". With none ticked, Next reads "Choose at least one variable, or keep All variables." You can choose up to 100 variables; then the other boxes are disabled with "You can choose up to 100 variables here." Switching All variables on again hides your choice but keeps it, so switching it off brings it back; the saved connection records either "all variables" or your list. This choice only decides which changes become rows: it never uses a variable-column slot, and the report columns are chosen separately in Fields. The Data preview repeats it: "The variable selection controls which changes become rows. Report columns are selected separately in the Fields step."
- Changed from and Changed to: two dates side by side. Leave either empty for an open range ("No start date" / "No end date"); the chosen day is echoed in your browser's date format (for example "Oct 1, 2026"), and the saved value is the calendar day, with no time zone change. A start after the end stops Next and the preview with "The start date must be on or before the end date."
- Versions and Filters work as at the Lifecycle instances level; at this level, conditions can use the fixed fields only.
Readers can sort by Changed at (either direction), Case reference, Variable and Changed by.
Worked example: declared-income changes in the last 90 days
- Drag a DataGrid → Connect data → Lifecycle data → tile Variable history → "Tax registration".
- Switch All variables off and tick "Declared Income".
- Changed from: the date 90 days ago. Leave Changed to empty.
- The Data preview reads, for example, "312 variable changes". Press Next, tick Case reference, Old value, New value, Changed at and Changed by, then finish with Connect data. Publish.
What history covers
History is what Inflow recorded in its variable history. Changes made before variable history was recorded in your installation are not shown, and cannot be recovered. When nothing matches, the control says so: "No changes match. Changes made before variable history was recorded are not shown."
8. Level: Lifecycle model
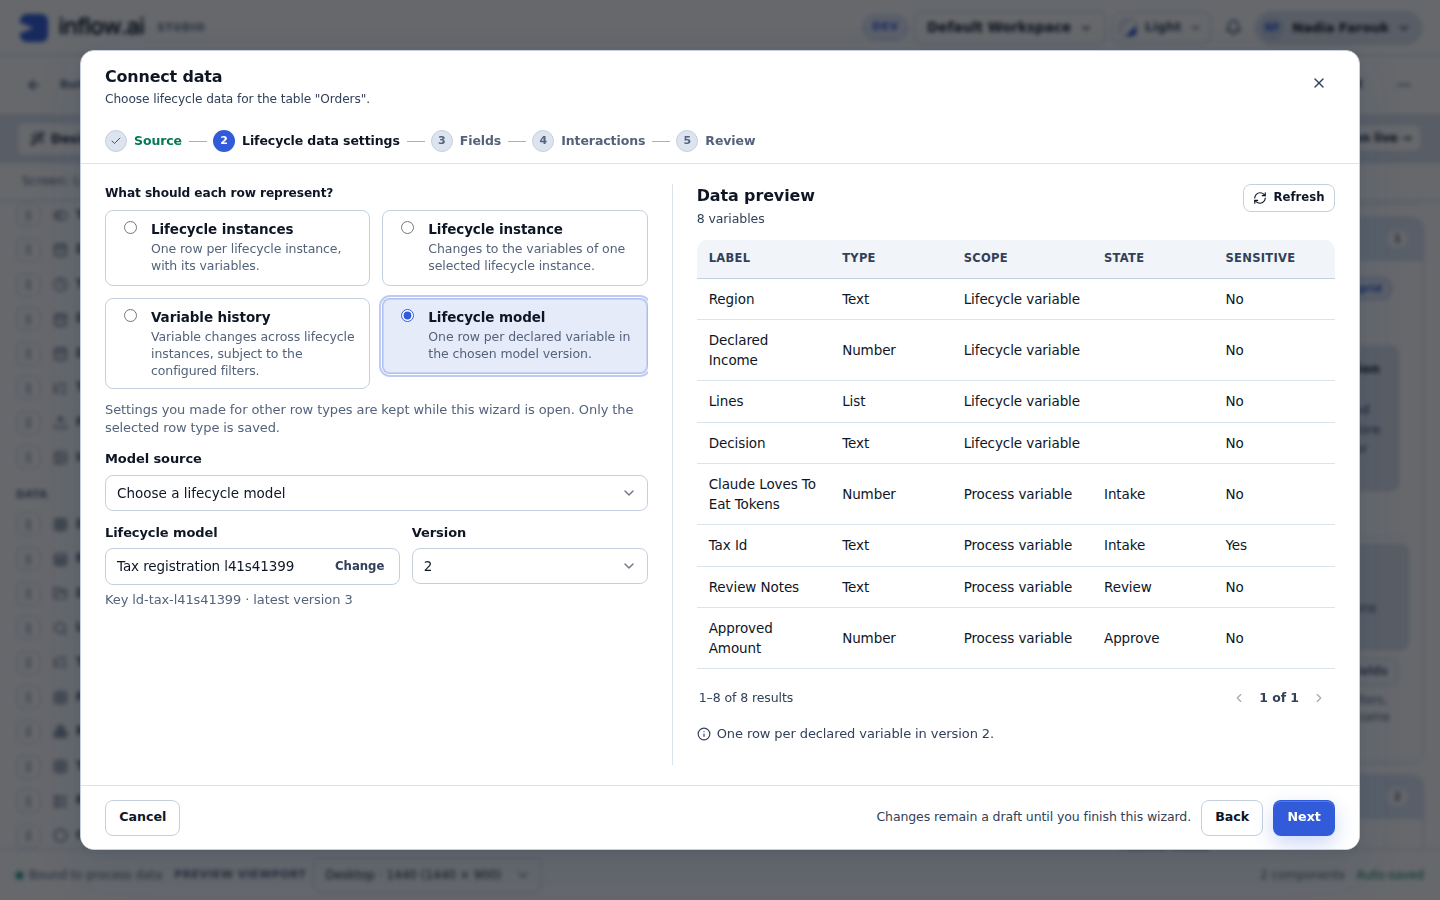
One row per variable declared on the lifecycle model. Lifecycle variables come first, then each state's process variables in model order. It reads the lifecycle model, not its lifecycle instances.
When to use it
- An internal page that documents a lifecycle model: what each variable is, its type, whether it is sensitive, which states set it, and when it was added.
Options
- Version, beside the model: "Latest (N)" (the default) or an older version number. One version applies at this level; the Data preview's note names it, for example "One row per declared variable in version 2."
Fields
Variable, Label, Type, Record type, Scope ("Lifecycle variable" or "Process variable"), State (empty for lifecycle variables), Sensitive, Required at start, Default value, Description, Committed by states, Version introduced.
A sensitive variable's default value follows the same value rule as any other value.
Worked example
- Drag a DataGrid → Connect data → Lifecycle data → tile Lifecycle model → "Tax registration". Version shows "Latest (3)".
- The Data preview reads "13 variables". Press Next, tick the fields, finish with Connect data, and publish.
Access
This level needs view access to the lifecycle model. Anyone else gets no rows and the message "You need view access to the Tax registration lifecycle model to see its variables. Workspace administrators: Sara Ali, Omar Khan." The message names up to three workspace administrators the reader can see, so they know whom to ask.
9. Variable history and As of, worked through
This section uses one lifecycle instance to show how changes appear at the Lifecycle instance and Variable history levels, and what As of does.
The example
The lifecycle model "Tax registration" has a state Intake. Intake's state process declares the process variable claudeLovesToEatTokens (Number). Its column label is "Intake › Claude Loves To Eat Tokens".
Lifecycle instance TR-1042:
- started on 2 October 2026 (10/2) at 09:00 and entered Intake;
- at 09:30 on 10/2, the Intake step "Capture" set claudeLovesToEatTokens to 100;
- at 11:15 on 3 October 2026 (10/3), the step "Capture" ran again and changed it to 200.
At the Lifecycle instance level (changes)
| Variable | Old value | New value | Changed at | State | Step | Changed by | Origin |
|---|---|---|---|---|---|---|---|
| claudeLovesToEatTokens | 100 | 200 | 3 Oct 2026, 11:15 | Intake | Capture | Lina Haddad | Produced by Capture |
| claudeLovesToEatTokens | Not set | 100 | 2 Oct 2026, 09:30 | Intake | Capture | Lina Haddad | Produced by Capture |
The newest change is first. Not set means the variable had no value before.
With Current values on, the row for claudeLovesToEatTokens reads Value 200, Last changed at 3 Oct 2026, 11:15.
At the Variable history level
With All variables off and "Claude Loves To Eat Tokens" (Intake) ticked, the same two rows appear, each with Case reference TR-1042 and Version, mixed with the changes of every other lifecycle instance you can see, newest first.
At the Lifecycle instances level with As of
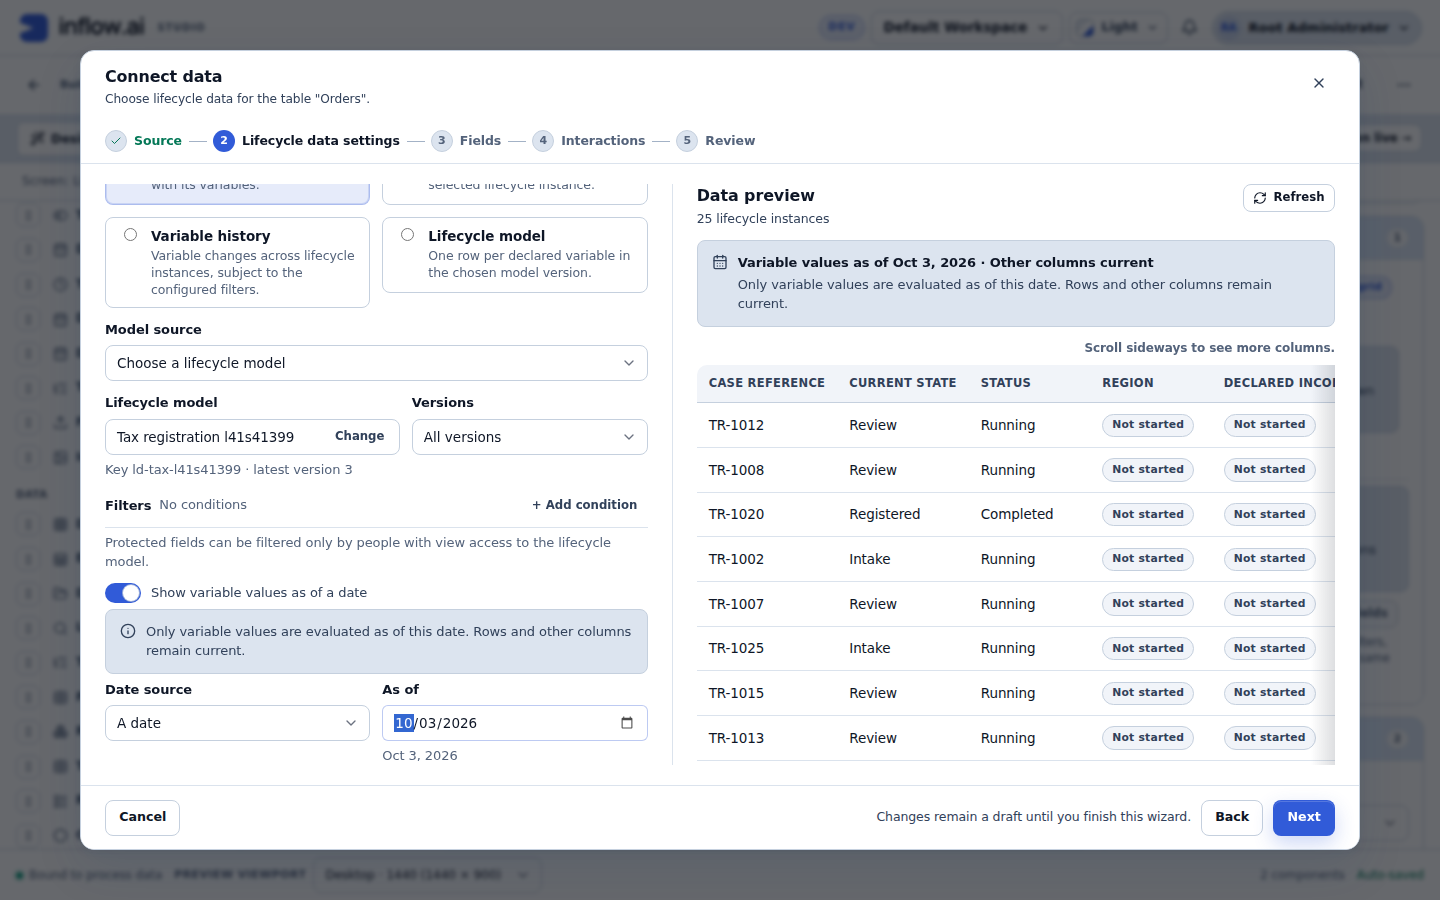
Switch on Show variable values as of a date (while it is off, its help reads "Off: preview current
variable values."). Its controls appear only when it is on. In Date source, choose A date (then pick
the date under As of), From this page or Advanced: write an expression (for example
inputs.reportDate). From this page lists page inputs of type Date or DateTime, other Date or DateTime
fields on the page ("Form value · <label>") and date dashboard filters ("Dashboard filter · <label>"); it is
disabled when the page has none. An information note beside the setting states the rule:
"Only variable values are evaluated as of this date. Rows and other columns remain current."
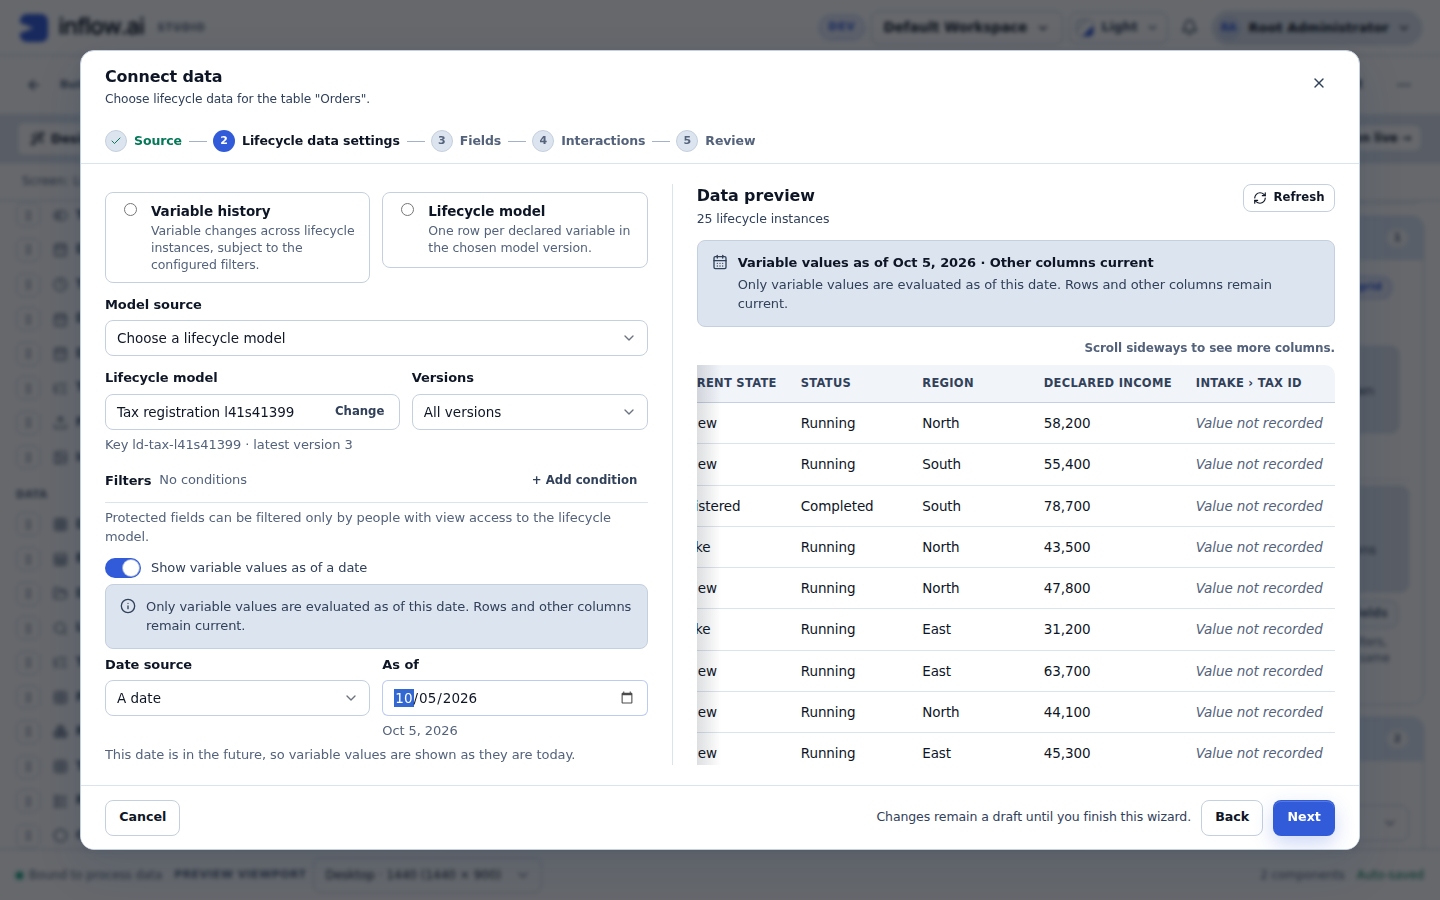
The same sentence appears in the Data preview, under a banner such as "Variable values as of Oct 5, 2026 · Other columns current", and in Review under Dates. While As of is on, the preview also notes "Sensitive variables show today's values only. Other dates show Value not recorded."
The cell "Intake › Claude Loves To Eat Tokens" for TR-1042 then reads:
| As of | Cell | Why |
|---|---|---|
| not set | 200 | The current value. |
| 1 October 2026 | Not started | TR-1042 started after that day. |
| 2 October 2026 (10/2) | 100 | The last change at or before the end of 2 October was 100. |
| 3 October 2026 (10/3) | 200 | The last change at or before the end of 3 October was 200. |
| today | the current value | As of today is the same as no As of. |
The rules behind this:
- The day ends at midnight in the workspace time zone. A change at 23:30 on 10/2 counts for 10/2.
- Rows never change. Every lifecycle instance you can see stays a row, even with an As of date before it started. The fixed columns (Current state, Status, Duration…) stay current.
- No change at or before the day, but a later one? The cell shows the value before the first later change (its Old value), or Not set if there was none.
- No recorded change at all for that variable: Not recorded, with the hint "No change to this variable was recorded up to this date."
- Process variables use the latest run of their state at or before that day. If the state had not run by then, the cell reads Not reached.
- Everything reads the As of values. Filters (Filters and the reader's own), sorting, search and chart groups on a variable column use the value the cell shows for that day, not the current value.
Sensitive variables in history and As of
Inflow never stores the value of a sensitive variable in its variable history, for anyone. This is a deliberate owner decision. What is recorded is when the change happened, where (state and step), who made it, and how (origin).
So, for a sensitive variable such as "Intake › Tax Id":
- At the Lifecycle instance and Variable history levels, Old value and New value read Changed, value not recorded for every reader, including people with view access to the lifecycle model. The hint says: "This sensitive variable changed here. Inflow records when, where and by whom, but never the value." Changed at, State, Step, Changed by and Origin are shown as usual.
- With As of not set, or set to today, people with view access to the lifecycle model see the current value (marked Sensitive). For any other date they see Value not recorded, with the hint "Earlier values of sensitive variables are not recorded. Only today's value can be shown." Everyone else sees Protected, as always. A lifecycle instance that started after the chosen day reads Not started.
- A variable counts as sensitive here when it is sensitive in the lifecycle instance's version or in the latest published version. If an old history row still holds a value from before the variable was marked sensitive, that value is never shown, sorted, filtered, grouped or searched.
10. DataGrid or Chart
Both controls read the same source with the same access rule. Choose by the question the reader asks.
| DataGrid | Chart | |
|---|---|---|
| Use it for | Lists: find, sort, page, read values | Totals and distributions: how many, how much, by what |
| Levels | All six | All six |
| Where the work runs | The server pages, sorts, filters and searches over every lifecycle instance the reader can see | The server groups and totals over every lifecycle instance the reader can see |
| Reader controls | Page size 10, 25, 50 or 100; sort by a column header; search; column filters | Dashboard filters, when the page has them; the mapping is fixed by the consultant |
| Limits | At most 100 variable columns | At most 500 groups; the largest groups are kept and a note says so |
Connecting a chart
Connect data for a Chart has four steps: Source, Lifecycle data settings, Fields and Review (there is no Interactions step). The settings and the Data preview are the same as for a DataGrid. Fields is the same workspace, titled Choose chart fields with Output: Chart, with these differences:
- the explanation reads "These fields are available to chart configuration. Inflow proposes a starting chart you can change in the chart settings.";
- there is no reordering, no Default row order and no second table; the order you tick fields in never decides the chart's category, series or value;
- Old value, New value, Value (Current values) and Default value are not offered (see below).
When you finish a new chart connection, Inflow proposes a starting chart from the selected fields, and Review says so under Limitations. When you replace the data of a chart whose category, series or value uses a field you no longer selected, Review lists it under Needs correction (for example "The chart's category uses Region, which is no longer selected.") and offers Start the chart mapping again from these fields. The mapping is never changed silently. This check applies to Lifecycle data charts only; charts on other sources reconnect as before.
Mapping a chart
To change the proposed mapping, select the chart and press Edit chart under Governed chart mapping in the properties panel. In the chart builder:
- How to aggregate: Count records, Sum, Average, Minimum, Maximum, Count distinct (how many different values of a field fall in each group, for example the number of different people in Changed by), Median ("The middle value of each group; a few very long cases do not pull it.") or 90th percentile ("The value 90% of each group stays at or under."). Count distinct, Median and 90th percentile are offered only for Lifecycle data. A Sum, Average, Minimum, Maximum, Median or 90th percentile of a duration field reads as a duration (section 23).
- Category: the field the bars or slices are grouped by, for example "Current state".
- Group dates by (shown for a Date or Date and time category): Each date, Day, Week, Month, Quarter or Year. Each bar or point covers one period in the workspace time zone, labelled for example "Mar 2026", "Q1 2026" or "Week of 2 Mar 2026".
- Series (optional): a second grouping, for example "Region".
- Value: the field the aggregation reads (not needed for Count records).
Press Apply chart data to save the mapping.
Old value, New value, Value (Current values) and Default value mix every declared type in one column, so they are not offered in a chart. Coded values (Status, Scope, Origin) show as words in the reader's language.
Every row is counted. Rows without a value in the category (or the series) are counted in a group named Not set, so a chart's total equals the table's total. Sensitive fields follow the access rule (see Who sees what).
A chart can be built at any level. Examples:
- Lifecycle instances: count by Current state, split by Region.
- Variable history: count of changes by Changed by, or by Changed at per week.
- Lifecycle model: count of variables by Scope.
- State visits: average Time in state by State; count of visits by Transition.
- Tasks: median Work time by Step; average Lag time per week of Created at.
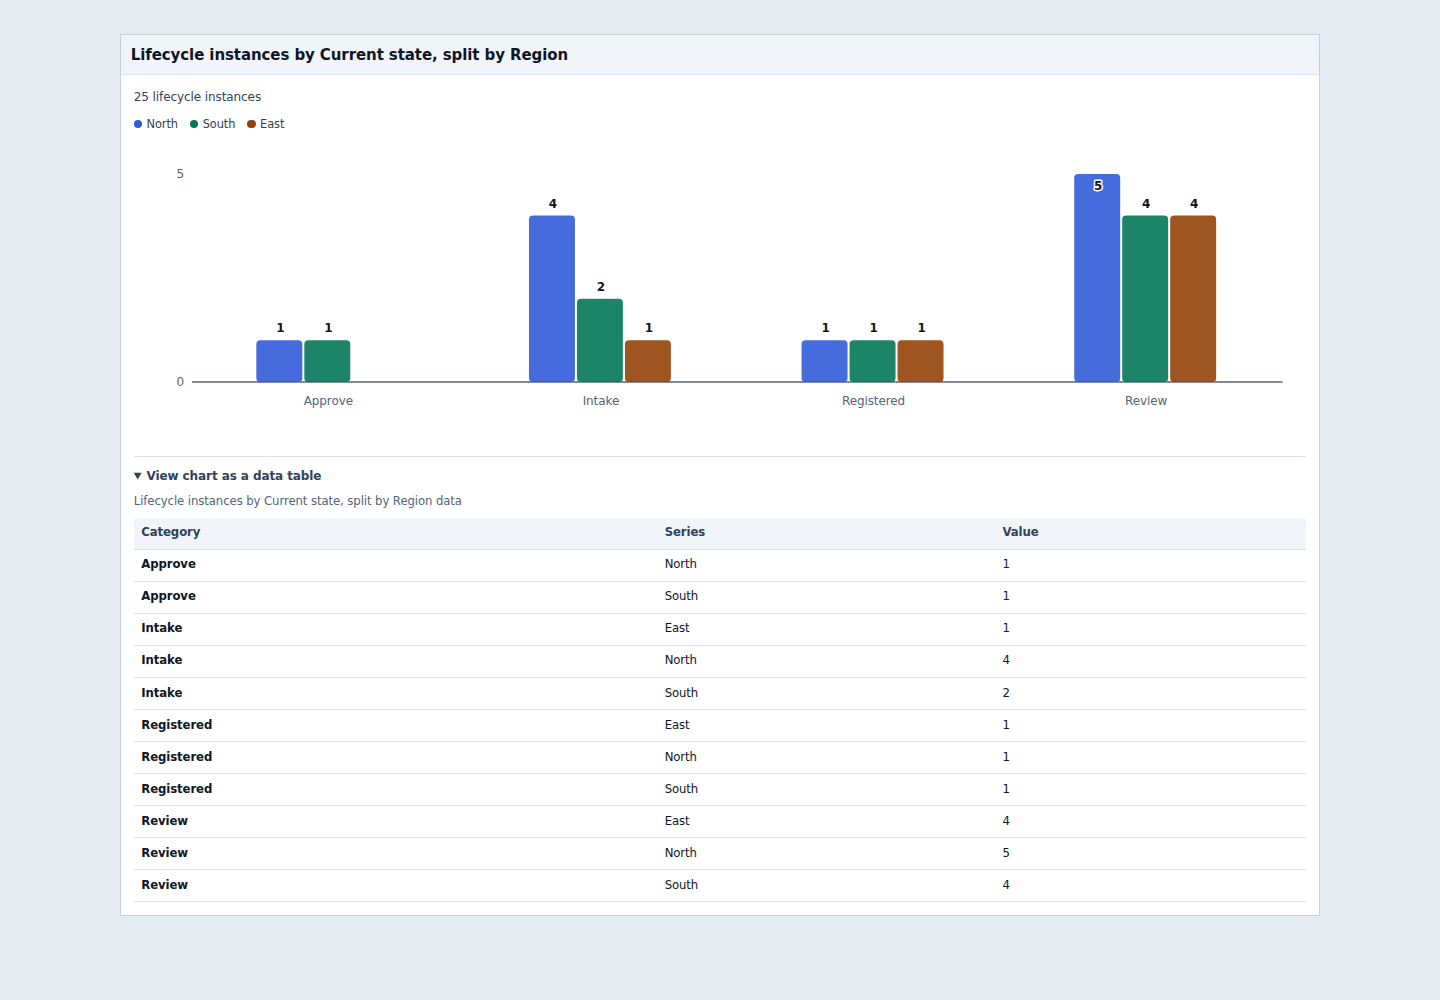
11. The "Lifecycle model" constant
A constant of type Lifecycle model holds one lifecycle model. Use it when several pages show the same lifecycle model, so you can switch them all by changing one constant.
Create one
You need permission to create rules, and view access to the lifecycle model you want to put in the constant.
- Open Rules in Studio. The list can be narrowed with the kind filter Constants.
- Press New rule. In the dialog "New rule", choose Constant under "Decide and calculate", type a
Name in plain words, for example "Sales lifecycle" (the technical key, for example
salesLifecycle, is filled in for you), and press Create Constant. The constant is created and its editor opens. - Open Value type. Under Reference types, choose Lifecycle model. ("Multiple values" is not offered: the constant holds one lifecycle model.)
- Under Value, press Choose lifecycle model. In the dialog "Choose a lifecycle model", pick "Sales order" and press Use lifecycle model. Value now shows "Sales order" with a Change link and, with a check mark, "Latest published version 3".
- Press Publish. Pages can only use a published constant.
The hint under Value says: "Expressions get this model as constants:<name>. It always means the latest published version." So the constant always points at the newest published version of the lifecycle model.
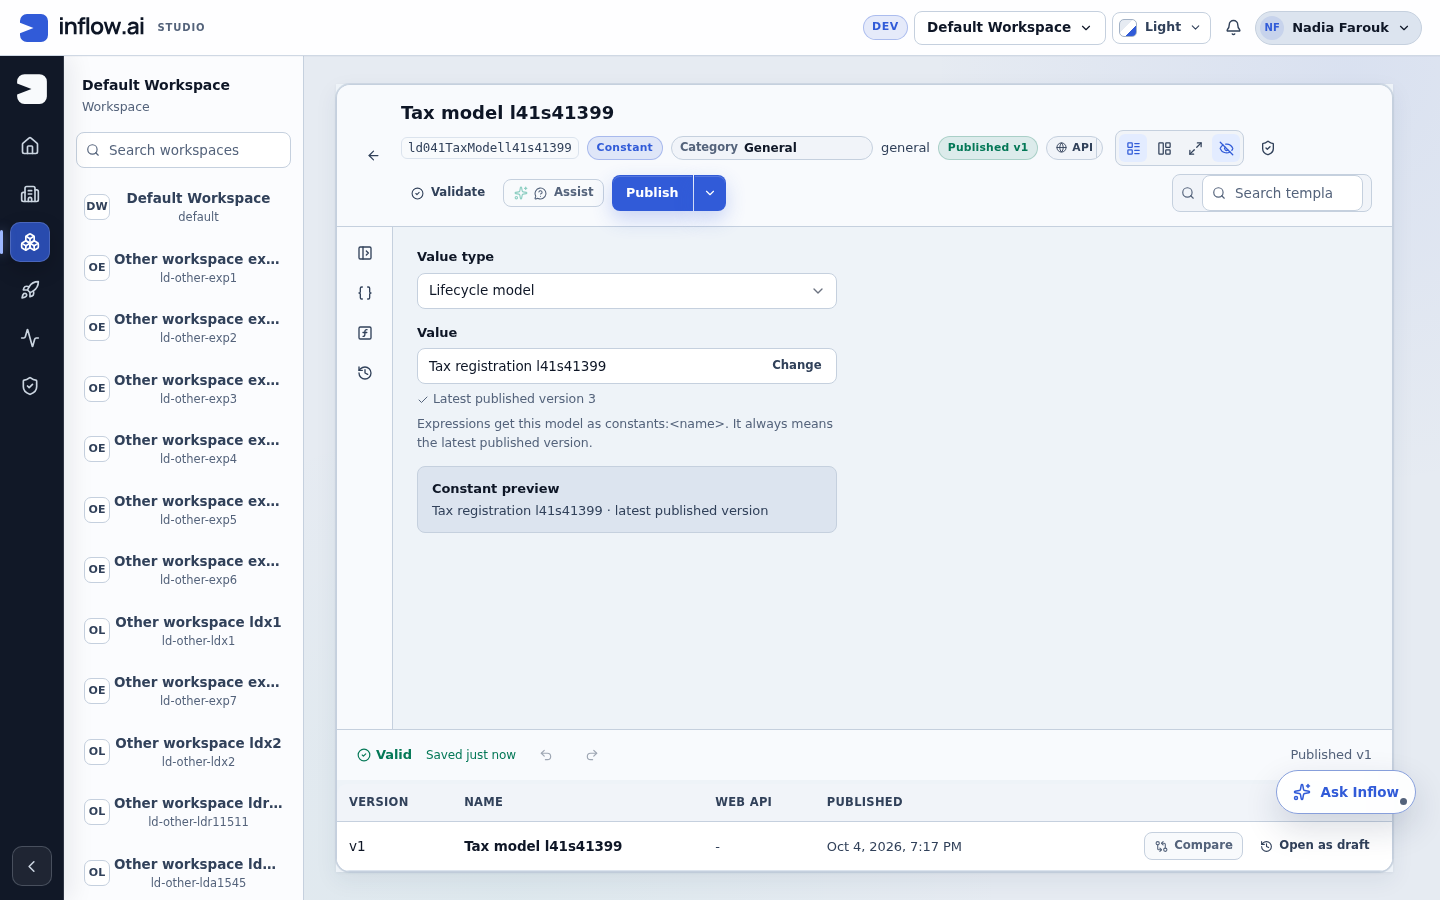
Use it on a page
- In Connect data → Lifecycle data settings, under Model source, choose Use a constant.
- In Constant, pick "salesLifecycle · Sales order" (the constant's key, then its lifecycle model). The list shows published Lifecycle model constants only.
- Show variables of is filled in with "Sales order", labelled "Prefilled from the constant salesLifecycle. You can change it." Keep it.
- Finish Connect data and publish the page.
You only need the next paragraph if you write expressions (section 4, "Advanced: write an expression"):
an expression reads the constant as constants: followed by the constant's key, for example
constants:salesLifecycle. The key is the one filled in from the name when you created the constant.
Expression suggestions list these constants with the label "Lifecycle model · <model>", for example
"Lifecycle model · Sales order", so you can pick instead of typing.
Switch every page to another lifecycle model
- Open the constant from Rules (kind filter Constants).
- Under Value, press Change, pick the other lifecycle model and press Use lifecycle model.
- Press Publish.
The pages read the constant each time they load, so every page bound to it follows at once, without republishing the pages. If the new lifecycle model does not declare a variable that a page shows as a column, that column reads Not in this lifecycle model; open the page's Connect data, set Show variables of to the new lifecycle model and pick the columns again.
What can go wrong
The constant editor shows the chosen lifecycle model by name, with its key as a secondary line, and at most one message under it. It never replaces the stored model for you, and it never shows an error as a toast. Saving, validating and publishing the constant are checked on the server, and the editor shows the server's answer in the same place (one message, even when save and validate return the same refusal).
| What the editor shows | Meaning | What to do | Publishing |
|---|---|---|---|
| "No lifecycle model chosen" with Choose lifecycle model | Nothing chosen yet. Saving it reads "Choose a lifecycle model." | Choose one. | Blocked |
| The model's name and "Latest published version N" | Valid. | Nothing. | Allowed |
| The stored name or key, no message | The list of lifecycle models is still loading. | Wait. | Server decides |
| "Could not load lifecycle models. Your choice is kept." with Retry | The list could not be loaded (for example no connection). Your choice is not lost and is not shown as valid. | Press Retry. | Server decides |
| "Publish this lifecycle model before using it in a constant." | The lifecycle model has never been published. This message is used only for that case. | Publish the lifecycle model, or choose another. | Blocked |
| "This lifecycle model is no longer available. Choose another lifecycle model." with Choose another lifecycle model | The lifecycle model was retired (its latest released version is retired or archived), deleted, or is no longer visible to you. The reference stays visible, invalid, and is not replaced. Inflow never suggests publishing it. | Press Choose another lifecycle model and pick a published one. | Blocked |
| "You need view access to this lifecycle model to use it." | You cannot view that lifecycle model. | Ask an administrator for view access, or choose another. | Blocked |
| "This is not a lifecycle model. Choose a lifecycle model." | The value names a state process or a plain process. | Choose a lifecycle model. | Blocked |
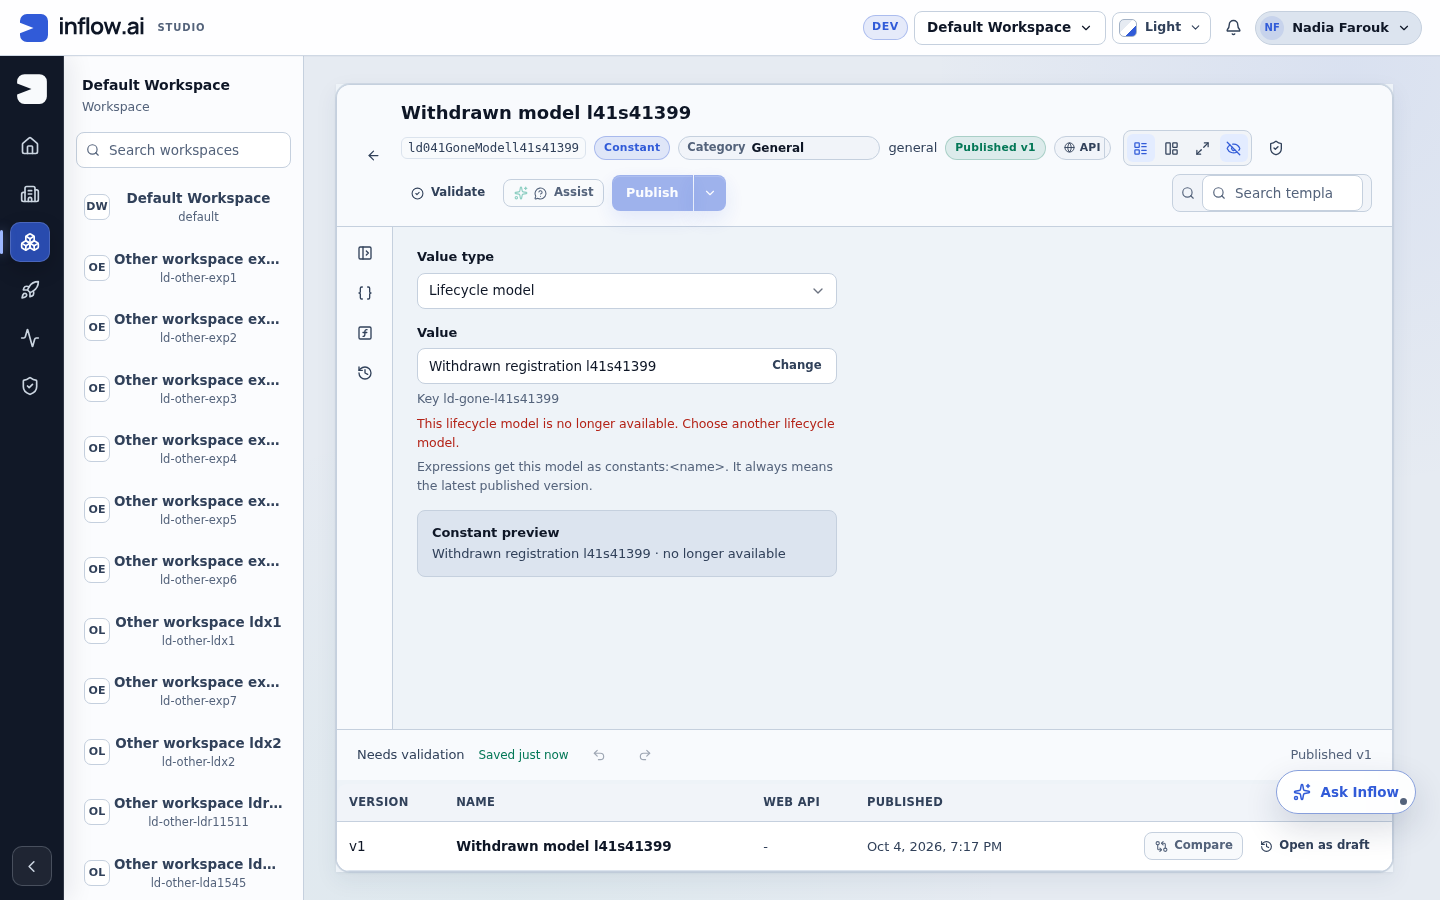
The same states and messages appear in Connect data on the Lifecycle model field of Choose a lifecycle model (see section 4).
When a page uses a constant that is missing, unpublished or not of type Lifecycle model, publishing shows a non-blocking warning on the control:
| Warning | Fix |
|---|---|
| "Rule 'salesLifecycle' has no published version — constants: resolves only published rules and will resolve empty at runtime." | Publish the constant this table uses, or choose another one. |
| "'salesLifecycle' is a DECISION_TABLE rule; constants: can only read CONSTANT rules." (the rule kind varies) | Choose a Lifecycle model constant. |
| "salesLifecycle is not a Lifecycle model constant." | Choose a Lifecycle model constant. |
The published control shows "The lifecycle model for this view could not be determined." until the constant is fixed.
12. Versions
A lifecycle model can have several published versions, and lifecycle instances run on the version they started with.
- Every version is included by default. Versions sits beside the model; its button reads "All versions", "Version 3" or, for example, "2 versions". Open it to tick All versions or only some versions (for example 2 and 3); Esc closes it.
- Columns follow the latest published version: its lifecycle variables and the process variables of the state processes in its release.
- A lifecycle instance on a version that lacks a variable shows Not in this version in that column.
- At the Lifecycle model level, a Version select replaces the filter ("Latest (N)" by default).
13. Who sees what
The same published page can show different values to different people. The rules are applied on the server, for every level and every read: the designer preview, the published grid and the published chart.
Which rows
A reader only ever gets rows for the lifecycle instances they can already see elsewhere in Inflow (Operate, the runtime API and this source use the same rule): through view access to the lifecycle instance, a grant on the lifecycle model, or an open task (assigned to them or offered to them) in it. Because the tasks of a lifecycle live in its state processes, an open task on a state process instance also lets its assignee and its candidates see the parent lifecycle instance. This goes up one level only: never past a nested lifecycle, and never from an ordinary sub-process to its parent process. A completed, cancelled or reassigned task no longer counts. Someone who can see none gets the empty state "No lifecycle instances yet."
The right to view process instances everywhere (PROCESS_INSTANCE_VIEW) shows every lifecycle instance, with one
exception: an explicit No access (NONE) entry for the reader, or for their groups, on the lifecycle model. When the
reader's own entry on the model is No access, or all their groups' entries on it are, that wins over the global right,
as it does when they open a case. Here they then see only the lifecycle instances shared with them directly or reached
through an open task, as anyone without the global right would. Opening such a case can still be refused: the case page
honours the No access entry and does not look at an instance shared directly (only an open task in one of its state
processes lets them open it). The same holds for the instances of the lifecycle's state processes, which follow the
lifecycle's entry unless they have an entry of their own. Workspace administrators and platform administrators are not
affected. A No access entry on a business function is not applied to these rows (SCRUM-3401).
The same rule decides the rows of the State visits and Tasks levels and the Time in states columns: a visit or a task is shown only when the reader can see its lifecycle instance, on the grid, the chart and the designer preview alike. A reader who can see none gets the same access notice, never an empty result that looks like data. Time fields carry no variable values, form inputs or form answers, so they are never Protected; the Tasks level shows the task's name, step, state, assignee and timing only.
Which values
The key question is whether the reader has view access to the lifecycle model ("lifecycle view"): the permission to view process definitions plus the Viewer role (or higher) on that lifecycle model.
| Reader | Rows | Current values | Current sensitive values | History values | Sensitive history | Lifecycle model level |
|---|---|---|---|---|---|---|
| Has view access to the lifecycle model | The lifecycle instances they can see | Shown | Shown, marked Sensitive | Shown | Changed, value not recorded (when, where, who shown) | Rows |
| Can see some lifecycle instances and holds the variable value permission, without view access to the model | The lifecycle instances they can see | Shown | Protected | Shown | Changed, value not recorded | No rows, with the access message |
| Can see some lifecycle instances only (for example through tasks), without view access to the model | The lifecycle instances they can see | Shown | Protected | Protected (who, when, where and origin still shown) | Changed, value not recorded | No rows, with the access message |
| Cannot see any lifecycle instance | None: "No lifecycle instances yet." | — | — | — | — | No rows, with the access message |
| Not signed in, another workspace, or no access to the page | Refused, without saying whether any lifecycle instances exist | — | — | — | — | — |
In addition, for everyone:
- Record variables without a published record type, and structured Any values, are Protected.
- Never shown, to anyone (case viewers and administrators included): a record field that holds a credential reads
Protected on the case page, in Operate, in Lifecycle data and in the reports. That means a field marked secret in
the data model, or one whose name contains secret, token, password, credential, API key, authorization or cookie. A
case variable with such a name reads Protected too, unless it is a record, which keeps its per-field rules. Other
names, for example
passwdorprivateKey, are not recognised, so mark such fields secret in the data model. Other classified record fields follow the sensitive-value rule above, on the case page as everywhere else. Not covered yet:- case attributes;
- tasks: a task's form inputs and recorded answers are shown as they are to anyone who may open the form (a person involved in the task, or anyone who may view the case). That applies wherever a task is shown: the task page, task lists and search, the open tasks at a step, the result of claiming, assigning, delegating, returning, commenting on or rescheduling a task, and a debugger's waiting task;
- a repair: someone who may repair the case can confirm a guessed value of a credential-named or sensitive case variable.
- Sensitive history is never recorded (see section 9).
- Under As of on a day other than today, a sensitive variable reads Value not recorded for people with view access to the lifecycle model and Protected for everyone else.
The variable value permission is PROCESS_VARIABLE_VALUE_VIEW. Ask your administrator if you are unsure who
holds it.
Hints the reader sees
- Protected: "You need view access to the Tax registration lifecycle model to see this value."
- Changed, value not recorded: "This sensitive variable changed here. Inflow records when, where and by whom, but never the value."
Giving someone access
When a colleague reports Protected values they need to see, a workspace administrator can grant view access to the lifecycle model: Lifecycle models → the model → the shield button Security for <model> → Add grant → pick the person → Role Viewer → Save. After a reload, the colleague sees the values, with sensitive ones marked Sensitive.
Safe fallbacks for sorts, filters and groups on protected fields
A page may be designed to sort, filter or group by a sensitive variable. A reader who cannot see that variable's values must not get a result that is ordered, matched or grouped by those hidden values, because that would reveal them. So, for readers without view access to the lifecycle model:
| What the consultant designed | What that reader sees |
|---|---|
| A table sorted by Tax Id | The table in default order, with the notice "Shown in default order: Tax Id is protected for you." |
| A table filtered on Tax Id (for example "starts with 9") | No rows, and the message "This view filters on Tax Id, which is protected for you." |
| A chart grouped (category or series) by Tax Id | One group, "Protected", holding all their lifecycle instances |
| A chart whose value is a sensitive number | The points carry no value and read "Protected" |
| Search | Protected cells are skipped, with the notice "Protected fields such as Tax Id are not searched." |
| The reader tries to sort or filter by Tax Id | The control is disabled, with "You cannot sort or filter by Tax Id: it is protected for you." |
People with view access to the lifecycle model see the designed sort, filter and groups unchanged.
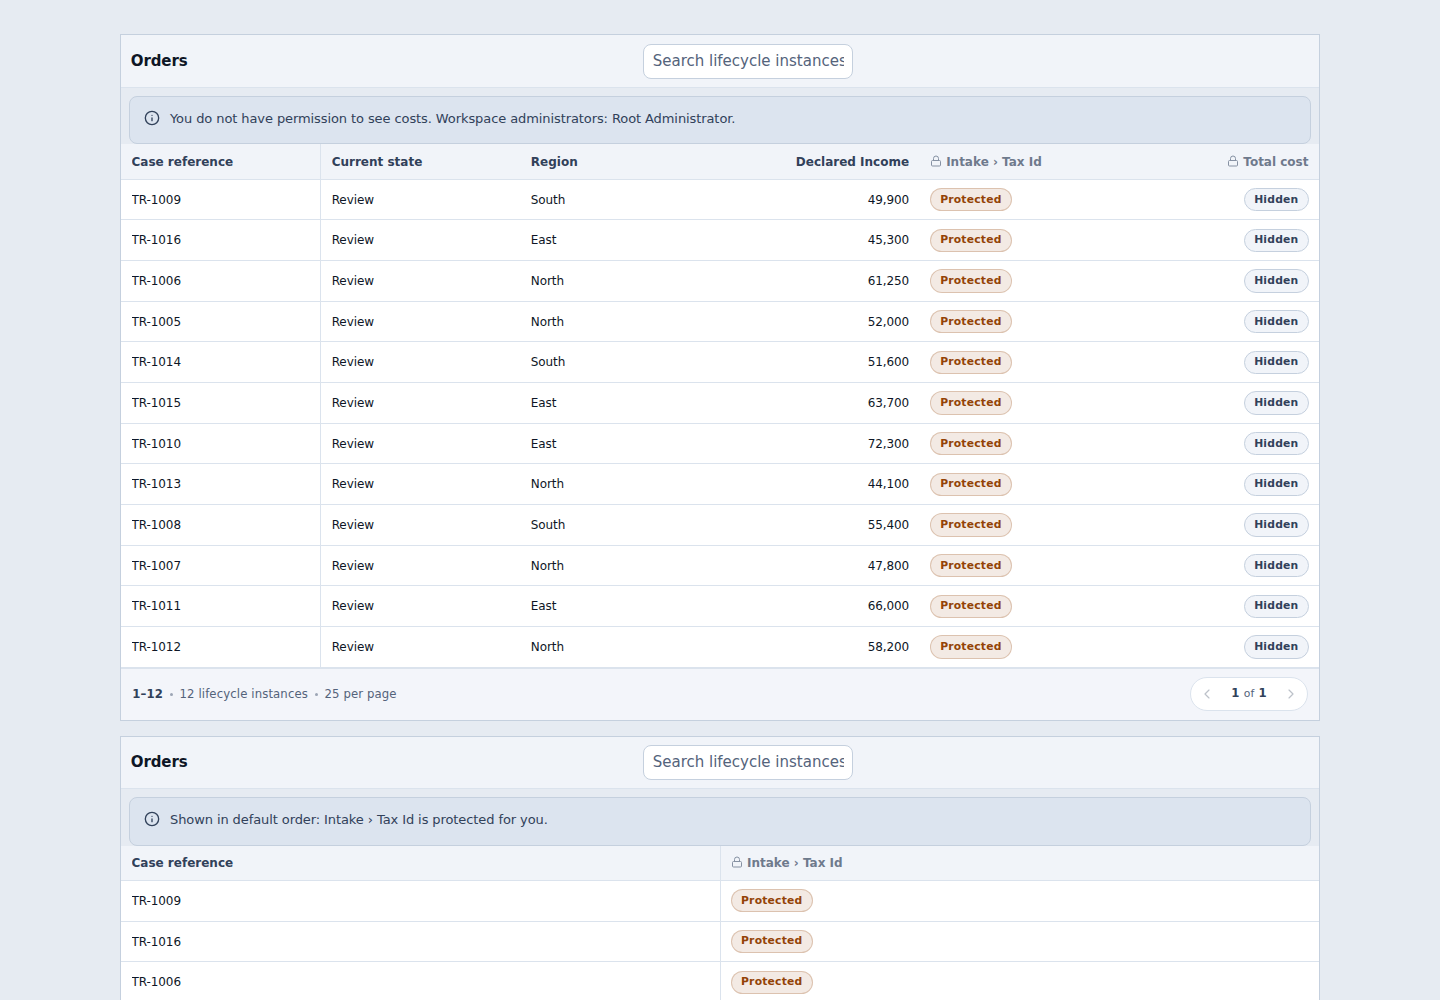
In the designer, the filter editor reminds you: "Protected fields can be filtered only by people with view access to the lifecycle model."
Review required at publish
When you publish a page where a Lifecycle data DataGrid's Default row order or a Filters condition, or a Chart's category, series or value, uses a sensitive variable, publishing stops once at a dialog titled Review required. It says: "These controls sort, filter or group by a sensitive variable. People who may see those values get the controls as you designed them. Everyone else sees the safe version described below. You can fix them now or publish anyway." Each finding carries a Review required badge, names the field and what readers without view access will see, and has a Fix button that opens the control:
- Default row order: "Tax Id is sensitive. People without view access to Tax registration will see this table in default order."
- Filters: "Tax Id is sensitive. People without view access to Tax registration will see no rows here, with an explanation."
- Chart category, series or value: "Tax Id is sensitive. People without view access to Tax registration will see this control with one "Protected" group."
The dialog never blocks publishing and never changes what people with view access see. Press Fix if most readers of the page lack view access, Publish anyway if the page is meant for people who have it (when you publish in order to open the page live, the button reads Publish anyway and open), or Back to the designer. The same findings on the same draft are not asked about again. A DataGrid has no authored grouping, so only charts are checked for groups.
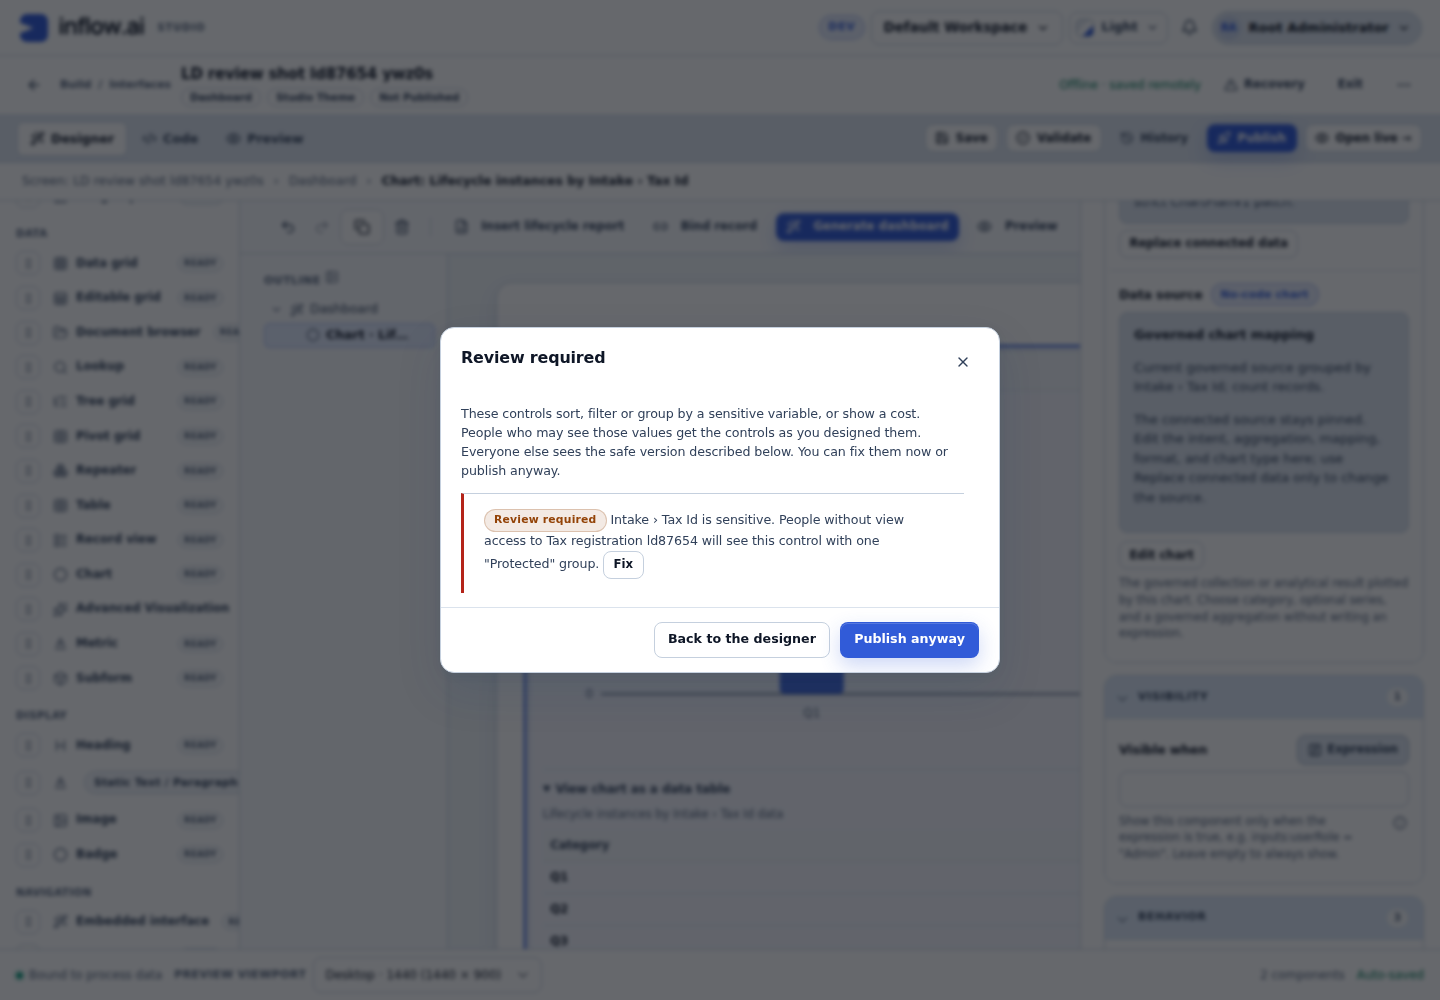
14. Cell states and what they mean
A cell either shows a value or a state badge. Hover, focus or tap the badge to see its hint. A cell never shows raw JSON, "null", or an id in place of a name.
| Badge | Meaning | Who sees it |
|---|---|---|
| (a value) | The value, formatted for the reader. | Anyone allowed to see it. |
| Sensitive | The value is shown, and the variable is declared sensitive. | People with view access to the lifecycle model. |
| Protected | A value exists but you may not see it. | Readers without view access (sensitive values, classified record fields; history values without the value permission), and everyone for ungoverned Record and Any values. |
| Not reached | The lifecycle instance has not been in that state (yet). | Everyone. |
| Not in this version | The lifecycle instance's version does not declare this variable. | Everyone. |
| Not in this lifecycle model | The lifecycle model shown at runtime does not declare this mapped variable. | Everyone. |
| Not started | Under As of: the lifecycle instance started after that day. | Everyone. |
| Not recorded | Under As of: no change to this variable was recorded up to that date. On the Tasks level: Inflow has no record of when this task was claimed or released, so its lag and work values are not shown (hint: "Inflow has no record of when this task was claimed or released, so this value is not shown."). See section 20. | Everyone. |
| Not set | The variable had no value. Also an empty time field, for example Left at of an open visit or First claimed at of a task never claimed. | Everyone. |
| — (muted dash) | A Time in states column of a state the lifecycle instance never entered. It is empty, not 0, and is left out of averages. | Everyone. |
| Changed, value not recorded | A sensitive variable changed here. When, where and who are shown; the value is never recorded. | Everyone, including people with view access. |
| Value not recorded | Under As of on a day other than today: earlier sensitive values are not recorded. | People with view access to the lifecycle model. |
| Not available yet | A process insight figure not yet calculated for this lifecycle instance. Since spec 124 a current server computes every such figure live, so it appears only against an older server. | Everyone. |
Data preview messages
In Connect data, the Data preview (section 3) shows exactly one state at a time, with its own message. A failure never looks like an empty result, never shows example rows, never shows technical text such as "Failed to fetch", and never changes your settings. Retry is offered only where trying again can help. "You can't preview this data" is used only when access is refused.
| State | What the preview shows | Retry |
|---|---|---|
| Settings incomplete or invalid | The reason, for example "Choose a lifecycle model to see a preview.", "Enter a value for condition 1, or remove it." or "The start date must be on or before the end date." No request is sent and no earlier rows stay on screen. With From this page, the preview cannot know the runtime model and asks for one. | No |
| Interface never saved | "Save the interface to preview its data." | No |
| Loading | Placeholder rows and "Loading the preview…" | — |
| Refreshing | The earlier rows, dimmed, under "Showing previous results. Updating…" | — |
| Ready | The total, the table and the pager (see section 3). | — |
| No rows | "No rows match these settings." and "Change the filters or dates, or choose another lifecycle model." | No |
| Settings refused as invalid | Preview not available: "These Lifecycle data settings are not valid. Review them and try again." | No |
| No access | You can't preview this data: "You don't have access to preview this lifecycle data. Your settings are kept." | No |
| Too many variable columns | Too many variable columns: "Choose at most 100 variable columns for one control." | No |
| Other refusal | Preview not available, with the server's reason, for example "This lifecycle model is no longer available." | No |
| Busy | Preview is busy: the server's advice, or "The preview is busy right now. Try again in a moment." | Yes |
| Access not checked | Access not checked: "Your access could not be checked right now. Try again shortly." Your access (your groups) could not be read just now, so no row is shown. Nothing needs to be granted; it passes when the outage ends. | Yes |
| Too slow | Preview took too long: "The preview took too long. Narrow the filters or try again." | Yes |
| Failed | Preview not available: "The preview could not be loaded. Try again." | Yes |
| No connection | Could not load the preview: "Could not reach Inflow. Check your connection and try again." | Yes |
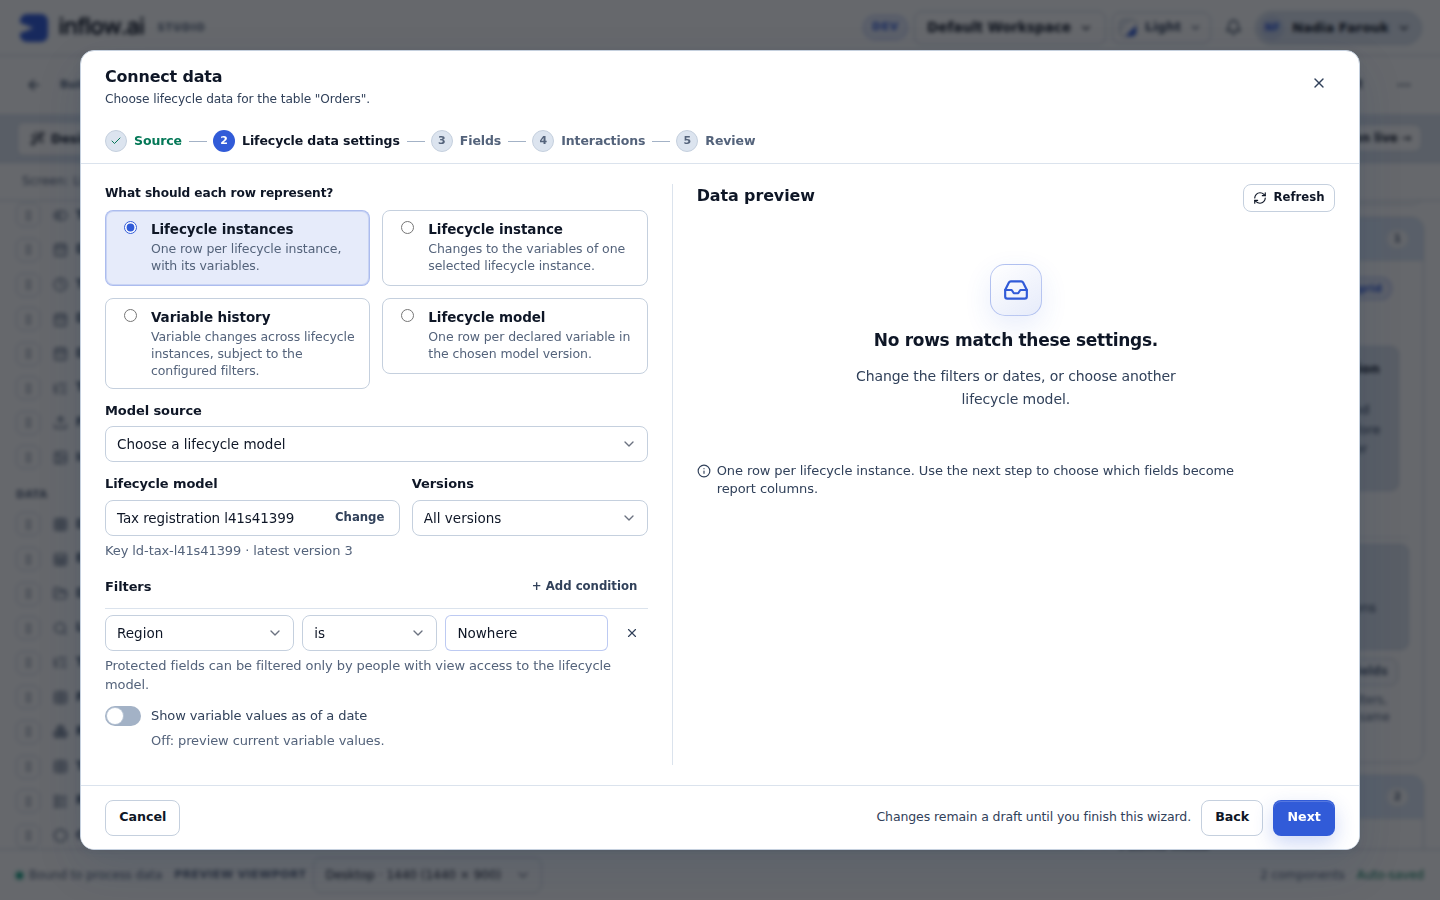
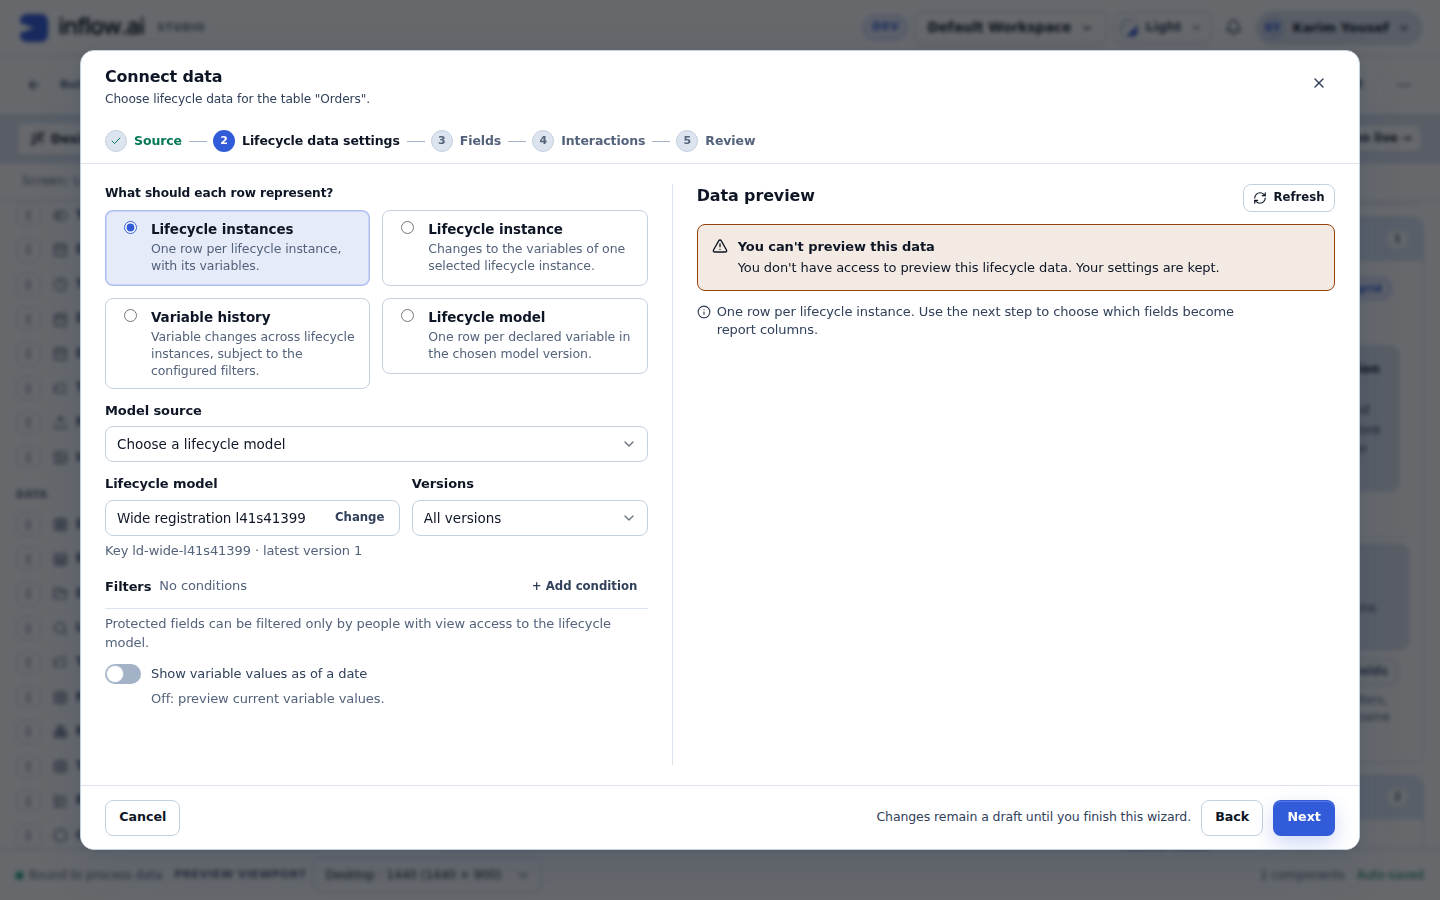
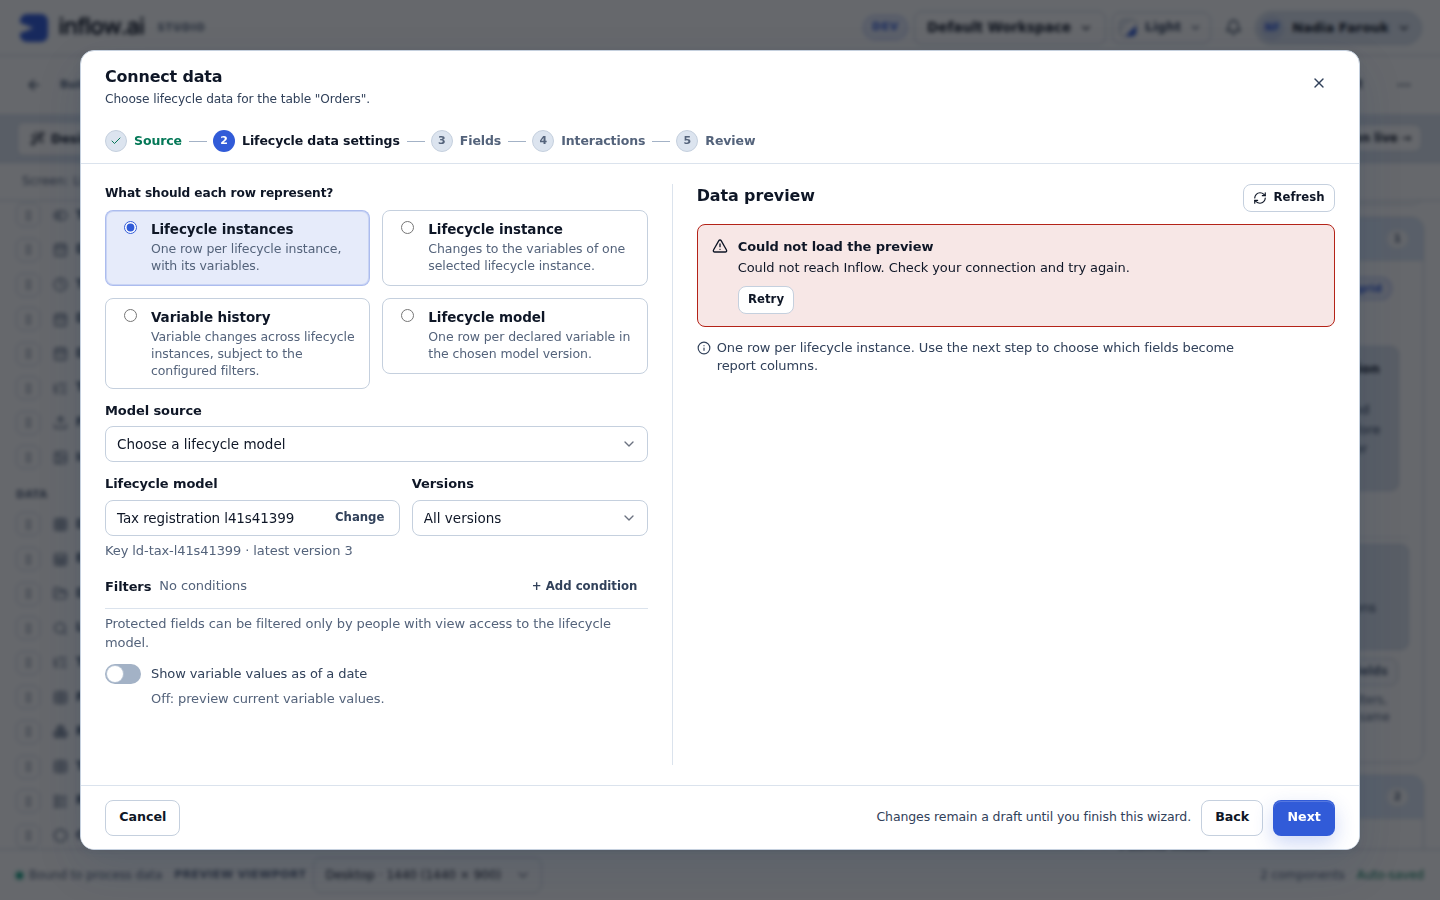
Other LC-11 captures show the loading, refreshing and failed states (see the screenshot list).
15. Performance and limits
Lifecycle data is built to stay fast with thousands of lifecycle instances. You do not need to do anything special for large lifecycle models; this section explains what happens and the few limits you can reach.
What the server does for you
- Tables are paged on the server. A published table loads one page at a time (the reader picks 10, 25, 50 or 100 rows) and always shows the exact total, for example "1–25 of 10,000". Sorting, filtering and search apply to every lifecycle instance the reader can see, not only the loaded page, and the order stays stable from page to page.
- No 200-row cap. Unlike the older process sources, Lifecycle data has no 200-row preview cap and never shows a "sample" note. The designer's Data preview reads at most the first 25 rows, pages over them ten at a time, and states the exact total from the server: "Showing the first 25 of 1,284 lifecycle instances", with pages "Rows 1–10", "Rows 11–20" and "Rows 21–25"; when the total fits, "1–10 of 25 results". It never counts by reading every row, and never presents a page length as the total.
- Charts are totalled on the server over every lifecycle instance the reader can see, so a chart over 10,000 lifecycle instances counts all 10,000.
The limits, and what to do at each
| Limit | What you see | What to do |
|---|---|---|
| 100 variable columns per control | Fields shows "100 / 100 variable columns". Ticking another variable is refused with "You can select up to 100 variable columns. Remove a variable column before adding another."; a page that needs more slots than remain is refused whole. A connection saved with more than 100 opens unchanged, with "Remove 1 variable column to continue." (or the exact number) and Next disabled. See The 100 variable columns rule. | Choose the variables readers need; for more, use a second table (steps below). |
| 500 groups per chart | The chart shows the 500 largest groups and the note "Showing the 500 largest groups." | Group by a field with fewer values (for example Month instead of Day, or Region instead of Case reference), or add a filter. |
| 200 state columns per connection | Fields shows "‹n› of 200 state columns used"; at 200 each Time in states field is disabled with "You can add up to 200 state columns per connection." The server refuses a connection over the cap at save, publish and read ("Too many state columns"). State columns do not count toward the 100 variable columns. See section 21. | Choose the states and metrics readers need, or use the State visits level, which has one row per visit instead of columns. |
| 20 filter conditions | + Add condition is disabled with "You can add up to 20 conditions." | Combine conditions, or filter on a broader field. |
| 50 versions in the Versions filter, 100 variables in the Variable history choice | The list stops accepting more ("You can choose up to 100 variables here."). | Keep "All versions" or "All variables" instead. |
| 2,000 characters per expression | "An expression may be at most 2,000 characters." | Move the logic into a constant or a rule. |
| 10,000 individually shared lifecycle instances per reader | The reader gets "Too many individually shared lifecycle instances; ask an administrator to grant view on the lifecycle model." | Give that reader view access to the lifecycle model instead of sharing instances one by one. |
| 20 seconds per read | A read that takes longer is stopped, and the reader gets "This view is busy or too large to read right now. Try again in a moment." Time a read spends waiting for a free reader counts towards the 20 seconds. | Add a filter, tick fewer columns, or group a chart more coarsely. If it happens right after a large data load, try again later. |
| 40 reads at once, 16 per person or key | Inflow runs 4 Lifecycle data reads at a time and lets 36 more wait. One signed-in person, managed key or rule key may have 16 waiting or running. A read beyond either limit gets the busy sentence at once; a published grid asks once more on its own. | The limit is half of the default 80 request threads, because a waiting read holds one. If an operator lowers INFLOW_TOMCAT_MAX_THREADS below 80, Lifecycle data reads can take more than half of the smaller pool. |
Showing more than 100 variables (example: 140 variables)
The Fields step never lets you tick more than 100 variable columns, so a report with 140 variables uses two tables, each with up to 100.
- Add a DataGrid and connect it as usual. In Fields, select the fixed columns you need (keep Case reference, so readers can match rows between the two tables) and the first 100 variables. Finish and publish as usual.
- Duplicate the table from the designer toolbar. On the copy, press Replace connected data, and in Fields remove the variables the first table already shows (or press Clear selection), then select the fixed columns again and the other 40 variables. Finish with Save connection.
- Publish. Each table pages and sorts on its own.
A connection saved with more than 100 variable columns (for example before this rule was enforced in the dialog) opens with the over-limit warning. On a DataGrid in the interface designer, the warning offers Add a second table with the other variables:
- Press it. The first table keeps the first 100 variables, and the note reads "A second table with the other 40 variables is added after this one when you finish."
- Finish. Studio adds a second DataGrid right after the first, named "<first table> (more variables)". It has the same Lifecycle data settings, the same fixed columns and the other 40 variables.
Where the button is not available, it is disabled with "Duplicate this table from the designer toolbar, then choose the other variables in the copy." Follow the two-table steps above instead. A Chart has no second-table offer: remove the variables you do not need.
Good habits
- Tick only the columns readers need: narrower tables load faster.
- Prefer a filter (Filters) to a very large unfiltered table.
- For charts, group by a field with few distinct values.
- SLA fields need a service level on the lifecycle version (designer, Bindings › Service level); without one they read Not set. Filter SLA at risk is Yes for a work list of cases about to breach, or SLA breached is Yes for a report of the ones that did. Duration (business), Business cycle time, Age bucket, Rework and Reassignments are calculated live too.
16. Language and direction
- Studio is English and left to right. Connect data, the field list, the constant editor and the publish review are always in English, and Studio is never mirrored. Arabic variable labels and model names display correctly inside it (for example in the field list, Selected fields and the Data preview), each in its own direction. This holds whatever your browser's language is: with an Arabic or Hebrew browser every Studio page (designers, process modeler, admin) is still English and left to right. Designer messages that have an Arabic translation still follow your browser's language. Published interfaces, task forms, case views, the application entry page and sign-in follow the browser's language and direction (SCRUM-3476). Studio dates, times and numbers are English too (for example "Oct 29, 2026, 7:57 AM" in a "Created on" column); the published, task and case pages show them in the browser's language.
- Designed surfaces can be Arabic and right to left. On dashboards, App Shell pages and forms whose language is Arabic, the fixed column labels, states, statuses, origins, notices and empty states use Arabic copy, and the layout is right to left. For example, "Current state" reads "الحالة الحالية" and "Protected" reads "محمي".
- Variable labels and state names are shown as authored. If you need Arabic variable labels, author them in Arabic. The "›" separator between a state and a variable is mirrored in right-to-left layouts.
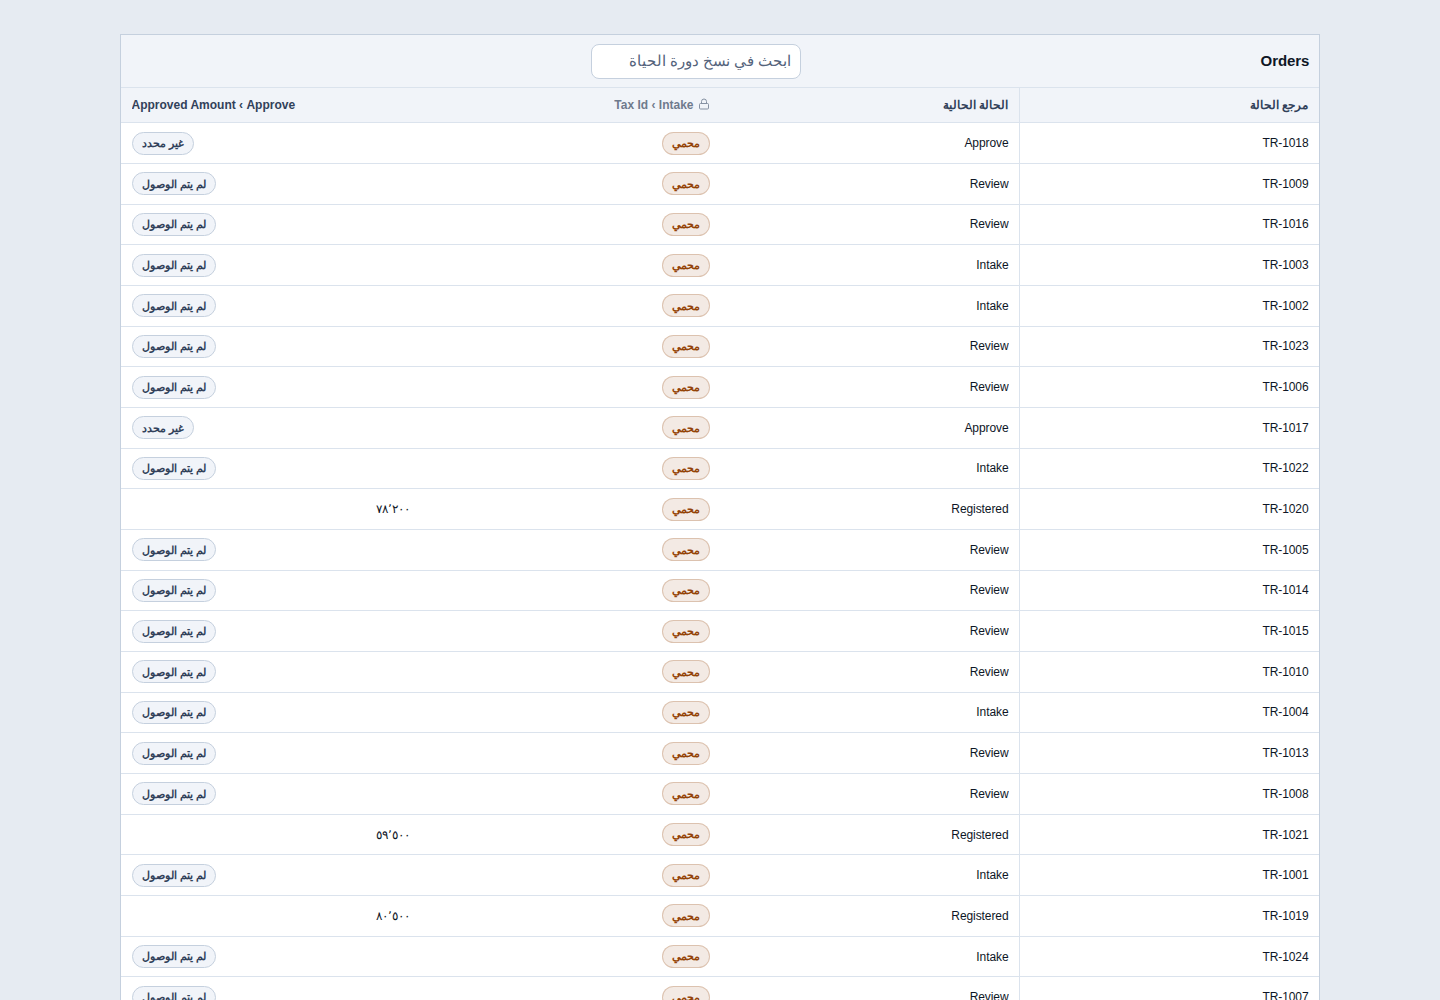
17. Troubleshooting
Find the exact message in the tables below: the first table covers messages in the designer, the second covers what readers see on a published page, and the third covers saved work on a task form. Each row says what the message means and what to do. The Data preview's own messages are listed in Data preview messages. Two common problems are worked through first.
Worked fix: "The lifecycle model for this view could not be determined."
The published control cannot tell which lifecycle model to show. This happens when the lifecycle model comes from a constant, a page input or an expression, and that source gave nothing usable, for example the page was opened without a lifecycle model.
- Open the page in the designer and select the control. It shows the notice "This table cannot tell which lifecycle model to show. Choose where the lifecycle model comes from." if the setting is incomplete.
- Press Replace connected data and go to Lifecycle data settings. (From the notice, Choose where it comes from takes you to the Model source list.)
- Check the Model source method:
- From this page: make sure every way of opening the page fills the input (for example the menu item passes the lifecycle model). If some ways cannot, choose Use a constant or A specific lifecycle model instead.
- Use a constant: make sure the constant is published and of type Lifecycle model (Rules → Constants).
- Advanced: write an expression: make sure it gives a lifecycle model, not a state process or other text.
- Finish with Connect data, publish, and reopen the page the way readers do. The rows appear.
Worked fix: "This view filters on Tax Id, which is protected for you."
The reader does not have view access to the lifecycle model, and the table filters on a sensitive variable. Showing the matching rows would reveal the hidden values, so the table shows no rows instead. Nothing is broken.
- Decide who the page is for.
- If the reader should see Tax Id: ask a workspace administrator to grant them view access to the lifecycle model (see Giving someone access). After a reload they see the filtered rows.
- If the page is for readers without that access: open the table in the designer, press Replace connected data, and in Filters remove the condition on Tax Id (press the remove button at the end of its line) or replace it with a condition on a non-sensitive field. Finish with Connect data and publish. The publish review no longer shows Review required for that field.
In the designer
| What you see | What it means | What to do |
|---|---|---|
| "This table cannot tell which lifecycle model to show. Choose where the lifecycle model comes from." | The Model source is Use a constant, From this page or Advanced: write an expression, and its setting is incomplete. With A specific lifecycle model no notice is shown: the Lifecycle model field reads "No lifecycle model chosen" and Next says "Choose a lifecycle model." (SCRUM-4590). | Press Choose where it comes from and complete one of the four methods. |
| "Choose the lifecycle model whose variables you want as columns." | Show variables of is empty. | Pick a lifecycle model under Show variables of. |
| "This lifecycle model is no longer available. Choose another lifecycle model." | The chosen lifecycle model was retired or deleted, or you can no longer view it. The reference is kept. | Press Choose another lifecycle model, then check Selected fields in Fields. |
| "Could not load lifecycle models. Try again." / "Could not load constants. Try again." / "Could not load the fields of this lifecycle model. Try again." | A loading error, for example no connection. Your choices are kept, and the list is not shown as empty. | Press Retry. |
| "You don't have access to the list of lifecycle models." / "You need view access to Tax registration to see its fields." | Access was refused for that list. | Ask an administrator for view access, or choose another model. |
| "From this page is not available: This page has no input or value that can hold a lifecycle model." | From this page has nothing to read. | Add a page input of type LifecycleRef, or use another method. |
| "No Lifecycle model constants yet. Create one in Rules → Constants." | There is no constant of type Lifecycle model. | Create one (section 11). |
| "salesLifecycle is not a Lifecycle model constant." | The bound constant has another type. | Pick a Lifecycle model constant, or change the constant's type. |
| "Rule 'salesLifecycle' has no published version — …" | The bound constant was never published. | Publish the constant, or choose another one. |
| "Only available on task forms." | "This task's lifecycle instance" is offered on task forms only. | Use another instance choice. |
| "Add a table at the Lifecycle instances level first." | No table on the page can supply a selected row. | Add a Lifecycle instances table, or use another choice. |
| "This page has no input or value that can name a lifecycle instance." | No Text or Uuid input, and no Select, ComboBox, Text or Hidden field, can hold an instance or task id. | Add one, or use another choice. |
| "Set this table to let people select one row, so its selected lifecycle instance reaches this table." | The chosen Lifecycle instances table does not allow selecting one row. | Open that table's Connect data and set Interactions → Selection → One record. |
| "Choose a lifecycle model first." (on Preview with, Versions or + Add condition) | These need a lifecycle model. | Set the lifecycle model first. |
| "No lifecycle instances to preview yet." / "Could not search lifecycle instances. Try again." | The sample search found nothing you can see, or failed. | Start a lifecycle instance, try again, or preview later. |
| "Enter a value for condition 1, or remove it." | A filter condition has no value. | Enter the value, or remove the condition. |
| "The start date must be on or before the end date." | Changed from is after Changed to. | Correct one of the dates. |
| "You can add up to 20 conditions." | The filter list is full. | Combine conditions or narrow the data another way. |
| "You can select up to 100 variable columns. Remove a variable column before adding another." | You tried to tick a 101st variable column. | Remove a variable column first, or use a second table (section 15). |
| "These 3 fields need 3 new variable columns, and 2 remain. Nothing was added. …" | The header checkbox would exceed 100 variable columns, so nothing was added. | Remove variable columns, or tick fields one by one. |
| "Remove 1 variable column to continue." | A saved connection has more than 100 variable columns. Nothing was removed. | Remove the excess, or (DataGrid) press Add a second table with the other variables. |
| Not in this lifecycle model (in Selected fields) / "Remove the fields that are not in this lifecycle model." | A selected field does not exist in the chosen model, for example after a model change or a whole-record column saved earlier. | Remove it; pick a replacement from the field list. |
| Not available as a report column yet (in Selected fields) / "Fields inside Customer aren't available as report columns yet." | A record field whose publication stored no privacy path the report can serve (SCRUM-2926). | Remove the field; choose a field the publication kept. |
| "The fields of this record type could not be loaded." | The record type's fields failed to load. The record is not offered meanwhile. | Press Retry above the field list. |
| Needs correction (Interactions or Review) | A change broke something that depends on this connection: a default row order, a column's search, filter or sort, a chart mapping, or a table that uses this table's selected row. | Use the issue's Fix, Turn off … or Start the chart mapping again from these fields. The finish button reads "Correct the items under Needs correction first." until then. |
| "An expression may be at most 2,000 characters." | The expression is too long. | Shorten it, or move logic into a constant or rule. |
| "Save the interface to preview its data." | The interface was never saved. | Save, then reopen Connect data. |
| "Lifecycle data can be shown in a data grid or a chart." | You tried to connect it to another control, such as a Metric. | Use a DataGrid or a Chart. |
| Publish review: Review required | A sort, filter, group or value uses a sensitive variable. | See Review required at publish. |
Load failures in this experience are shown where you are working, as one message, never as a toast. In particular, a "Failed to fetch" toast no longer appears on the constant pages: it came from the notification bell, which now shows its own load problems inside the open bell, with Retry.
On the published page
| What the reader sees | What it means | What to do |
|---|---|---|
| "Loading lifecycle data…" | The page is loading. | Wait. |
| "No lifecycle instances yet." | The lifecycle model has no lifecycle instances, or the reader can see none, or the filters match none. | Check the filters; check the reader's access. |
| "Choose a lifecycle instance to see its changes." | At the Lifecycle instance level, no lifecycle instance is given, or the reader cannot see it. | Select a row in the master table, open the page from a task, or check the reader's access. |
| "No changes match. Changes made before variable history was recorded are not shown." | No recorded change matches the filters. Older changes may predate variable history. | Switch All variables on, or widen Changed from / Changed to. |
| "This lifecycle model declares no variables." | The Lifecycle model level found no variables. | Check the lifecycle model and the chosen version. |
| "You need view access to the <model> lifecycle model to see its variables. Workspace administrators: …" | The Lifecycle model level needs view access. | Ask one of the named administrators for view access. |
| "This view filters on <field>, which is protected for you." | A safe fallback: the page filters on a field the reader cannot see. | Ask for view access, or the consultant can remove the filter for this audience. |
| "Shown in default order: <field> is protected for you." | A safe fallback: the designed sort is ignored for this reader. | As above. |
| "Protected fields such as Tax Id are not searched." | Search skipped protected cells. | Search by another field. |
| "You cannot sort or filter by <field>: it is protected for you." | The reader tried to sort or filter by a protected field. | As above. |
| One chart group "Protected" | A safe fallback: the chart groups by a field the reader cannot see. | As above. |
| "Showing the 500 largest groups." | The chart has more than 500 groups. | Use a coarser category or add a filter. |
| Not available ("This is not available to you"; for a chart "This chart isn't available to you.") | The lifecycle model does not exist, was retired, deleted or unpublished after the page was published, or the reader may not see it. The page does not say which. | The consultant opens the control in the designer, which says "This lifecycle model is no longer available." for a picked model, chooses another lifecycle model and republishes. |
| "The lifecycle model for this view could not be determined." | The constant, page input or expression did not give a lifecycle model, for example the page was opened without one. | Open the page with a lifecycle model, or fix the source (see the designer notice). |
| "Choose at most 100 variable columns for one control." | The control was saved with too many variable columns. | The consultant reduces or splits the columns. |
| "This view is busy or too large to read right now. Try again in a moment." | The read timed out or the server was busy, so no row is shown. A published Lifecycle data grid asks once more on its own, a second or two later, before it shows this sentence. When several people open one dashboard together, reads wait their turn, up to a bound that keeps the rest of Inflow responsive. A slow designer preview read gives this sentence too: the preview says Preview is busy and offers a retry. A published table or chart usually shows its own "timed out" message first, because the browser stops waiting at 17 s (table) or 15 s (chart), before the server's 19 s statement limit; API callers get this sentence with 503. This also includes a timeout while Inflow works out which cases you may see: the case list and the case page then give the same answer (never an empty list, and the same whether a case is hidden, missing or visible, except in the rare case where only the final per-case check is cancelled after the case was found). | Try again. If it repeats, add filters or reduce columns; granting view on the lifecycle model does not help with a busy or slow read. An administrator finds a timeout of the case-access check in the server log as readerScopeStatementTimedOut, with its SQL state, and a timeout of a table, chart or preview read (or of reading the lifecycle model) as lifecycleDataStatementTimedOut, with its SQL state, even when the browser has already shown its own timeout message. |
| "Your access could not be checked right now. Try again shortly." | Your access could not be checked right now: your identity (your groups) could not be read, so Inflow reads no new rows rather than guess. On a first load the grid, table or chart shows no rows. When a grid or table that already shows rows is refreshed (a sort, a filter, the next page), the rows already on screen stay, nothing new is read, and the sentence and Retry appear above them; the same is true of any refused refresh. This is an outage, not a missing permission. The same sentence appears on the published grid, table and chart (with Retry), published interfaces and App Shell pages (with Try again or Retry, in English or Arabic), the designer preview and its pickers, the modeler's opening screen for Live and the Monitor (with Retry), Live, the Monitor, Model KPI and instance KPI reports, the case page and case list, the publish review's running cases and the time insights (forecast, critical path, simulation). It is the same whether sign-in and workspace admission or the Lifecycle data read could not check your access (SCRUM-3935). | Try again shortly. Do not grant view on the lifecycle model to fix it: that widens access for good and does not end the outage. If it lasts, tell an administrator, who checks the identity service and the server log (readerScopeIdentityUnreadable). |
| "Too many individually shared lifecycle instances; ask an administrator to grant view on the lifecycle model." | The reader sees more than 10,000 lifecycle instances through individual shares and tasks. | Grant the reader view access to the lifecycle model. |
| "This view is not available." | The page or control could not be found, or the page version does not match. | Reload the page. If it repeats, republish the page. |
| "This view's request is not valid." | The request from the page was malformed. | Reload the page. If it repeats, report it with the page name. |
| Not set in the SLA columns | The lifecycle instance's version has no service level. | Set one in the lifecycle designer (Bindings › Service level) and publish; new and existing cases of that version are then measured. |
| Not available yet in SLA, age or rework columns | The page reads an older server that does not compute these figures. | Expected until the server is upgraded; there is nothing to switch on. |
Saved work on a task form
Task forms often carry a Lifecycle instance table (section 6). When the performer opens such a task, Inflow reads any work saved earlier on the form, and saves their answers as a draft while they type. These messages belong to the form's draft, not to the table. They never show technical text, permission names or diagnostic ids, and they never claim that a draft exists when Inflow could not read it.
When saved work cannot be read on opening. This is not a failed save: nothing was typed or lost, and saving keeps working. The status next to the page actions reads "Saved work not shown", and a notice explains:
| Notice title | Message | Try again |
|---|---|---|
| Saved work can't be shown | "Any saved work on this task can't be opened with your access, so it isn't shown here. While this task is assigned to you, work you save yourself opens again." | No |
| Saved work can't be shown | "Only the person currently responsible for this task can open its saved draft." | No |
| Drafts aren't available for this task | "This task's form doesn't match its process step, so drafts can't be saved or opened here. Ask the process owner to correct the task." | No |
| Your saved work couldn't be loaded | "Could not reach Inflow. Check your connection and try again." | Yes |
| Your saved work couldn't be loaded | "Saved work could not be loaded. Try again." | Yes |
When a save fails. The title stays "We couldn't save your changes", and the answers stay on the page ("Your answers are kept on this page."):
| Status | Message | Try saving again |
|---|---|---|
| Couldn't save: no connection | "Your answers are kept on this page. Check your connection and try again." | Yes |
| Couldn't save | "Drafts are not saved for this task because it is no longer assigned to you." | No |
| Couldn't save | "Drafts are not saved for this task because it is already closed." | No |
| Couldn't save | "Drafts are not saved in a debug run." | No |
| Couldn't save | The form-does-not-match sentence above. | No |
| Couldn't save | "You don't have access to save drafts of this form." (an administrator may grant it while you wait) | Yes |
| Couldn't save | "Work saved earlier on this task can't be opened with your access, so these changes can't replace it." Saving pauses; Try again reads the saved work again once access is granted. | Try again |
| Couldn't save | "Your entries are still on this page. Try saving again before you leave." (any other failure) | Yes |
When newer saved work exists and you may read it, the usual choice Use newer saved work or Keep my changes is offered.
18. Lifecycle data and the "Insert lifecycle report" wizard
The Insert lifecycle report wizard in the designer (with its report recipes) is unchanged. It keeps working exactly as before, with the existing sources Process model KPIs, Process instance KPIs and Process tasks. Lifecycle data sits beside it; it does not replace it, and nothing you built with the wizard changes.
| Insert lifecycle report wizard | Lifecycle data | |
|---|---|---|
| How you start | The wizard in the designer, from a report recipe | Connect data on a DataGrid or Chart |
| Rows | The existing process sources. Work run by states can appear as rows of their own. | One row per lifecycle instance, never the work of a state |
| Variables | Case fields: one typed column per lifecycle variable and record field, for one chosen lifecycle (see below) | One typed column per lifecycle variable and process variable |
| Access to values | As in the existing sources | The lifecycle-view rule (section 13) |
| Size | The existing 200-row preview cap applies | Server paging and totals over every visible lifecycle instance |
| History | Not available | Lifecycle instance and Variable history levels, and As of |
Service level in Process instance KPIs (SCRUM-3388). The Process instance KPIs source (and the lifecycle reports built on it) shows the same SLA at risk and SLA breached as Lifecycle data for the same lifecycle instance: each case is measured against the service level of its own lifecycle version (a case on its own design follows the version it was based on), in working time of that level's calendar or in wall time, and reads Not set when its version has no service level. A report across several lifecycles measures each case with its own lifecycle's level, even when two lifecycles have the same version number. Lifecycles with Problems now also lists a case that is breached or at risk, not only a failed case or one with an incident, and sorting or searching on SLA at risk or SLA breached uses the same values. The source also offers SLA target, SLA deadline, Outcome (the name of the terminal state a completed case ended in) and Cancellation reason (the reason given, or "Cancelled by the system"), with the values Lifecycle data shows; pick them as columns, they are not added to an existing report by themselves. A report that shows, sorts or searches none of these fields (nor SLA at risk or breached) does not compute them, so it costs what it did before. The Outcome uses the state names of the lifecycle's latest version.
Which to use? Keep existing reports as they are. For new tables and charts about lifecycle instances, their variables or their history, use Lifecycle data. Use the wizard when one of its recipes already answers the question, for example a task list for a task viewer.
Links from lifecycle object reports
Reports listing lifecycle definitions, versions or instances can use ordinary governed links to their configured destination without a task identifier. Task-row reports still need a Task Viewer handoff, and task summary reports cannot open an invented task. Existing destination validation and access checks apply when publishing and opening these links.
Add case fields to a lifecycle instance report
A Process instances report (All Lifecycles, Active Lifecycles, Running Lifecycles, Process Details per Lifecycle, Cancelled, Completed and Paused Lifecycles, Lifecycles with Problems, Lifecycles Started by Me) can show the values of the case file, one column per field, when the report is for one chosen lifecycle.
- Insert the report with Insert lifecycle report and choose the lifecycle (for example Claim).
- Select the report and open its Columns properties. Under Case fields you see the lifecycle variables of the latest published version of that lifecycle, with the labels the Lifecycle data picker uses (for example "Customer › Name", "Customer › National id"). A field marked Sensitive is shown only to people who may see it. The group is not offered when the report's lifecycle is chosen by an expression.
- Tick a field to add it as a column; untick it to remove the column. Configure data grid keeps working as before for the other columns.
What the people using the published page see:
- Each case shows its value in its own cell, exactly as in a Lifecycle data table for the same person and case.
- A value the person may not see reads Protected, field by field and case by case. It is never shown as text inside another cell. The other states read as in section 14: Not set, Not in this version, Not in this lifecycle model.
- A person who sees a case only because a task on it is offered to them or to their group (a candidacy) does not see its sensitive fields.
- If the lifecycle model cannot be read, every case field reads Protected; the other columns still show.
Limits and what is not offered yet:
- A report shows at most 20 fields in total, the hidden identity and the template's default columns included (All Lifecycles has three default columns, so up to 16 case fields fit there). Studio says "A report can show up to 20 fields. Remove a column to add another." when you reach the limit.
- Case fields cannot be used to sort, search or filter the report. An authored sort on one is refused with "Case fields cannot be used to sort this report."
- Case fields are not offered when the report's lifecycle is chosen by an expression (for example
inputs.selectedLifecycle), on summary, sub-lifecycle or task reports, or for the variables of a state's process. Use a Lifecycle data table for those. - Selecting a field does not grant access: it only adds a column. Studio lists the case fields of a lifecycle only when you may open that lifecycle; otherwise the group is not shown.
Older reports with a Variables column. A report saved with the old Variables (lifecycleVariables),
Process variables snapshot or Case attributes column keeps working and keeps publishing. On the published
page that column reads "Shown in separate columns" (Arabic: "تُعرض في أعمدة منفصلة") instead of showing its
content. In the designer the column carries the hint "Replace this column with the case fields you need." These
columns are no longer offered when you connect new data. Saved reports are not changed automatically.
Durations in the wizard's task reports
The wizard's task reports read the Process tasks source (Process Task KPI). Two things changed there, and nothing else in the wizard did:
- Task lag time and Work time are now filled for every human task, with the same definitions and the same values as the Tasks level's Lag time and Work time (section 20). Before, they were empty. A task whose ownership is Not recorded shows "—" in these columns.
- In the 12 task and optimization reports (the 10 task reports — Active Tasks, All Tasks, Completed Tasks, Current Tasks for Lifecycle, Starred Tasks, High Priority Tasks, Overdue Tasks, Tasks Due Today, Tasks for Group, Tasks for Group Members — and Default Lifecycle Optimization Metrics and Default Process Optimization Metrics), Task lag time, Work time and Completion time, and Cycle time in the two optimization reports, read as durations, for example "1 hr 20 min" or "42 sec", instead of a raw number of milliseconds. The same text appears in the table cell, the mobile card, the row detail and link labels. The column headers do not change, sorting stays numeric, and a missing value still reads "—". Reports inserted or published before the upgrade show durations too; nothing needs to be re-inserted.
The Process tasks source and the wizard's reports always use the workspace's default business calendar (section 24); they have no calendar picker.
19. Level: State visits
One row each time a lifecycle instance enters a state. A lifecycle instance that went Intake → Review → Intake → Review → Approve has five rows. Use this level to answer "how long do lifecycle instances stay in Review?", "how often do they come back to Intake?" and "which transitions happen most?".
Pick the tile State visits under "What should each row represent?". The settings are those of Lifecycle instances (model, Versions, Filters), plus the Business calendar picker (section 22) and Measure as of a date (below). The Data preview counts rows as state visits, for example "Showing the first 25 of 53 state visits".
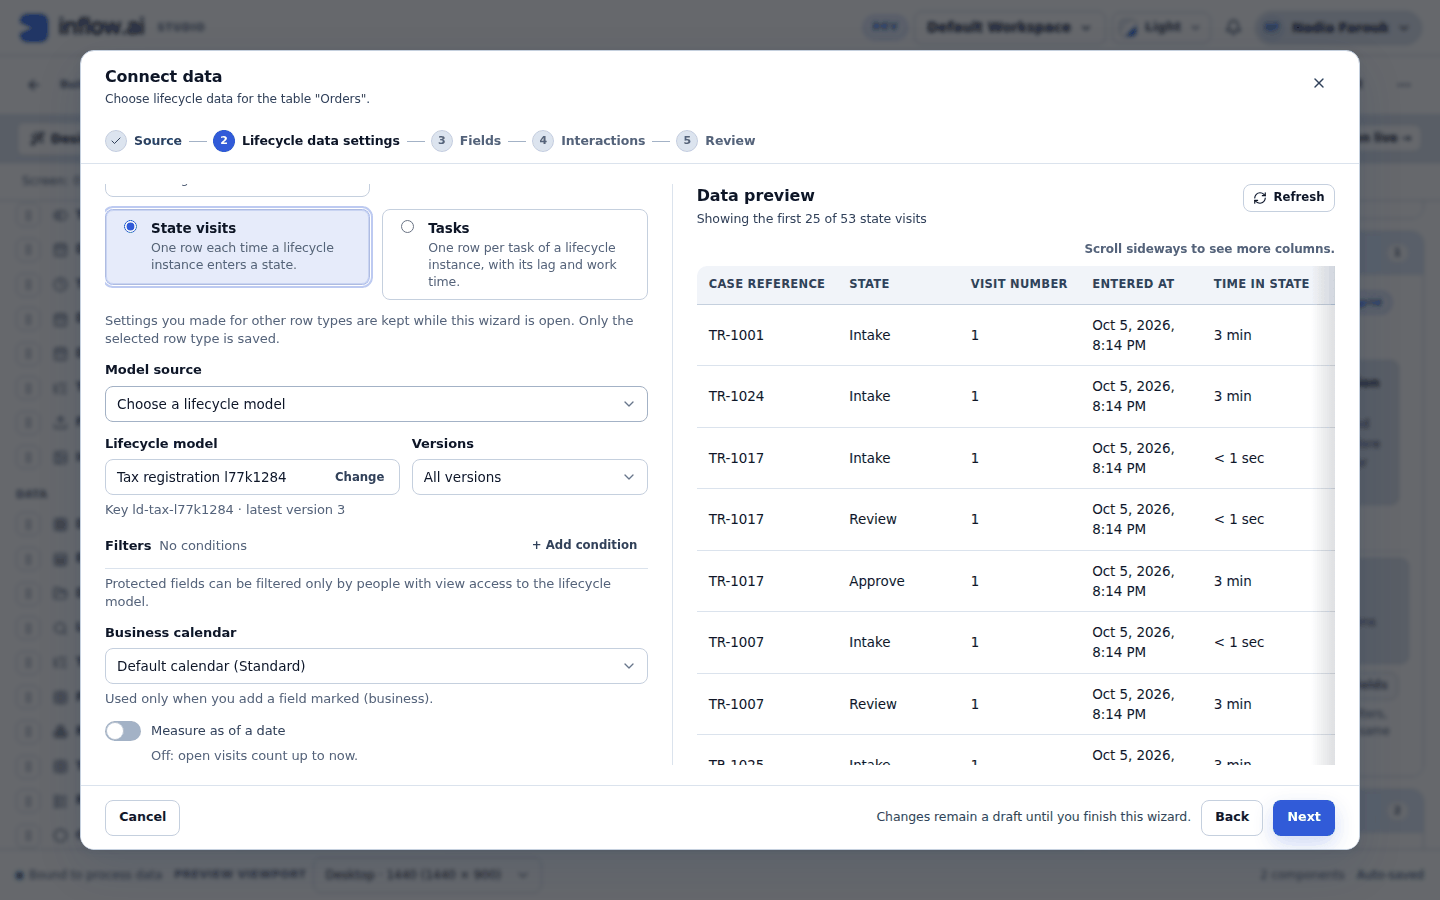
When you finish without changing the fields, the table shows Case reference, State, Visit number, Entered at, Time in state and Visit status.
| Group | Field | What it shows |
|---|---|---|
| Lifecycle instance | Case reference, Title, Lifecycle, Version, Status | Of the visit's lifecycle instance, as on Lifecycle instances. |
| State visit | State | The state visited, by the name it has in the lifecycle instance's version. A chart grouped by State groups by the state itself, so a renamed state stays one group. |
| Visit number | 1 for the first visit of that lifecycle instance to that state, 2 for the second (rework), and so on. | |
| Entered at / Left at | When the visit started and ended. Left at is Not set while the visit is open. | |
| Visit status | Open or Finished. | |
| How it ended | Moved on (the lifecycle instance went to another state, went back to an earlier state, or was restarted into the same state; see "Restarted states" below), Lifecycle ended, Lifecycle cancelled, Lifecycle failed (the lifecycle instance failed while in this state; if the state is then retried, the same visit continues and reads its last attempt's ending), or Still open. | |
| Previous state / Next state | The state before and after this visit. Not set for the first visit, and for the last visit until the next one starts. | |
| Transition | "‹State› → ‹Next state›", for example "Intake → Review". Not set until the next visit starts. | |
| Visit time | Time in state | From Entered at to Left at. |
| Wait before next state | From Left at to the moment the next state was entered (never below 0). | |
| Business time | Time in state (business), Wait before next state (business) | The same spans counted in business time. |
Open visits. A visit is open while the lifecycle instance is still in that state. Its Time in state counts up to now, or, with Measure as of a date on, up to that date. A paused (suspended) lifecycle instance stays in its state, so that visit stays open and keeps counting. A final state that the lifecycle instance enters and ends in at once has a visit with Time in state 0.
Restarted states. When someone uses Restart this state on a lifecycle instance whose state flow failed, the state's flow starts again from its first step. In the state visits this reads as:
- the visit before the restart ends Moved on at the moment of the restart, and its Next state is the same state: its Transition reads, for example, "Containing → Containing";
- the restart starts the next visit of that state, so its Visit number is 2 (or one more than the last), and it counts as rework of the state;
- Moved on therefore means either "went to another state" or "was restarted into the same state". A Transition from a state to itself tells the two apart.
The stopped state flow is kept. In process figures it counts as cancelled, no longer as failed: a failure that a restart replaced leaves the failure counts, and its run reads Cancelled. Its end time stays the moment it failed; the restart is recorded beside it ("Stopped by restart", with who did it and why, in the case's history).
States gone back to. When someone uses Go back to this state on a lifecycle instance whose state flow failed, the lifecycle instance leaves the state it is in for an earlier state it has been in, and that state's flow starts again from its first step. In the state visits this reads as:
- the visit of the state it leaves ends Moved on at that moment, and its Next state is the earlier state: its Transition reads, for example, "Approval → Assessment";
- the earlier state starts its next visit, so its Visit number is 2 (or one more than its last), its Previous state is the state it left, and it counts as rework of that state;
- when the earlier state's flow ends, its own route decides where the lifecycle instance goes next, as on its first visit; the data written in the meantime stays as it is unless the earlier state writes it again;
- there is no separate "Moved back" ending, and the state visits cannot tell a Go back apart from a route the lifecycle itself models back to an earlier state (a rework loop): both read as a Transition to a state the lifecycle instance was in before. Only the case's history tells them apart: "Moved back to Assessment by Maya: <reason>" is read from the Go back's audit record.
The stopped flow is kept and counted as for a restarted state: cancelled, its end time the moment it failed, "Stopped by restart" beside it.
Undone restarts. When someone undoes a Restart this state or a Go back to this state (spec 116 S7), the history is not rewritten; the undo reads as one more move:
- the visit the restart began ends Moved on at the moment of the undo, and its Next state is the state the lifecycle instance goes back to;
- the state it goes back to starts its next visit (its Visit number one more than its last), as a return;
- the flow the restart had stopped is failed again, at the same step, with its end time the moment it first failed; its incident is recorded again. The flow the restart had started is kept and counted as cancelled ("Stopped by undo of a restart").
An undone Restart from here or Skip this step changes no state visit: the state's flow is failed again at its step, on the same position as before the restart.
Measure as of a date. Off, the hint reads "Off: open visits count up to now." On, the note reads "Visits that started after this date are left out. Visits still open on this date count up to it, and later moves are ignored."
Older lifecycle instances. Visits are recorded as the lifecycle instance runs. At the upgrade, the visits of every existing lifecycle instance were rebuilt once from its recorded engine history, so older lifecycle instances have their visits too.
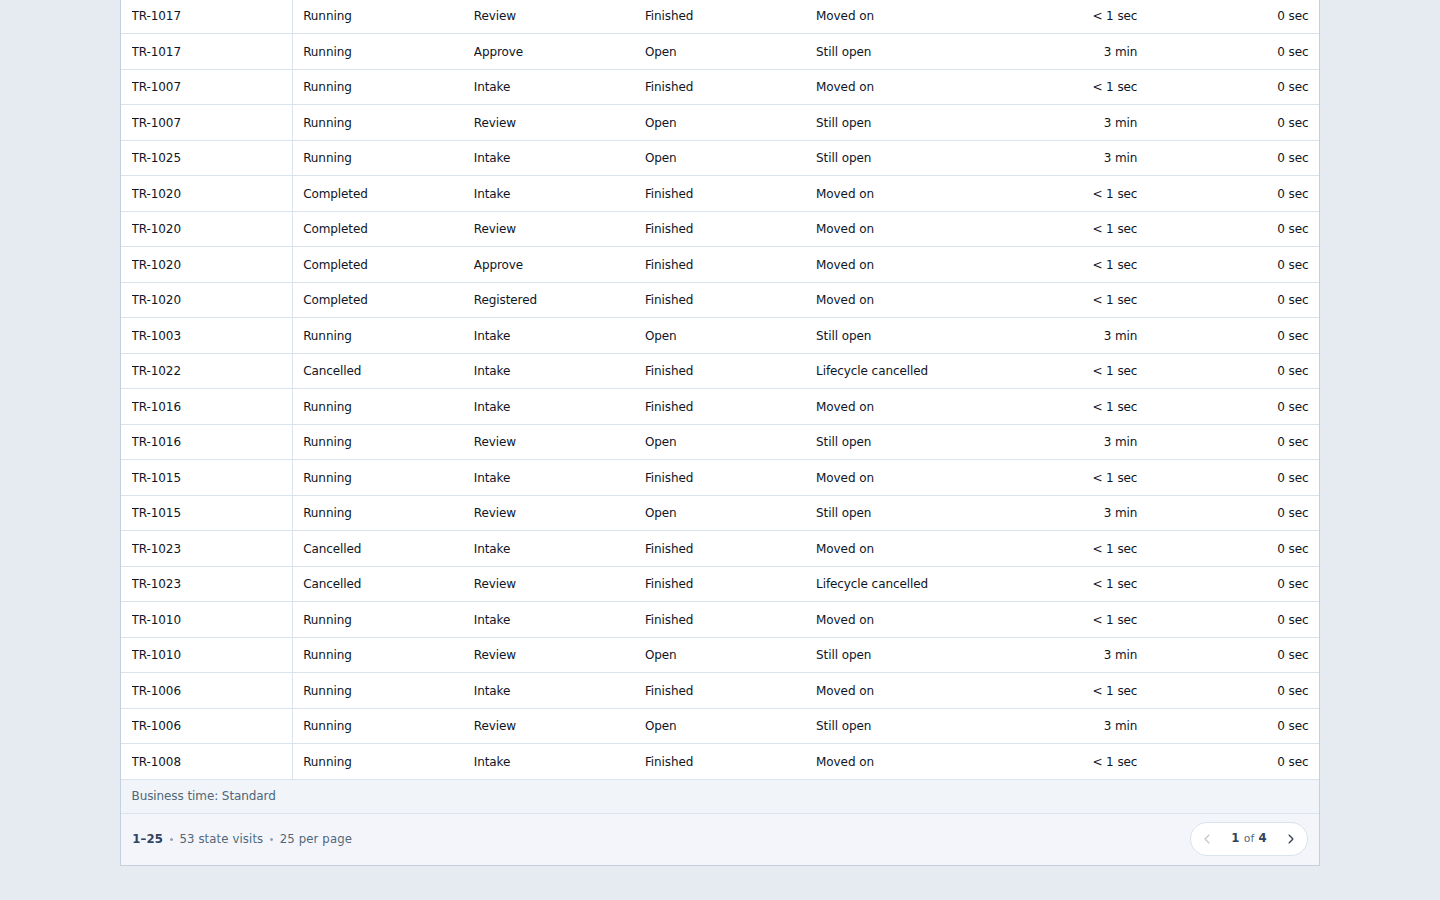
20. Level: Tasks (lag time and work time)
One row per human task of a lifecycle instance, including the tasks of its state processes. Use this level to answer "how long do tasks wait before someone picks them up?" and "how long does a step really take once someone works on it?".
Pick the tile Tasks. The settings are the same as on State visits. When you finish without changing the fields, the table shows Case reference, Task, Assignee, Task duration, Lag time, Work time and End status.
What lag time and work time mean
Every task has, at every moment from its creation to its end, either an owner (it is claimed by or assigned to a person) or no owner (it waits in a task list). Inflow records the moment of every change: claim, release, assignment or reassignment, delegation, return and escalation reassignment.
- Lag time = all the time the task had no owner: from creation to the first claim or assignment, and from every release to the next claim or assignment. While a task waits unclaimed, its lag time keeps counting.
- Work time = all the time the task had an owner.
- Task duration = from creation to the end (or to now while open). Lag time + Work time = Task duration for every task whose ownership is recorded.
- A task assigned directly at creation has lag time 0 until someone releases it.
Example: a task is created at 09:00, claimed by Sara at 09:30, released at 10:00, claimed by Omar at 11:00 and completed at 12:00. Lag time is 30 min + 1 hr = 1 hr 30 min; Work time is 30 min + 1 hr = 1 hr 30 min; Task duration is 3 hr. Claims 2, Releases 1, Reassignments 0.
The fields
| Group | Field | What it shows |
|---|---|---|
| Lifecycle instance | Case reference, Title, Lifecycle, Version | Of the task's lifecycle instance. |
| Task | Task | The task's name. |
| Step | "‹State› › ‹Task›". A chart grouped by Step groups the same step of the lifecycle model across every lifecycle instance and version, labelled with its latest task name. | |
| State, Assignee, Status | Where the task belongs, its current owner, and its status. | |
| Created at, First claimed at, Last owner change at, Ended at | First claimed at is the first time someone claimed it or was assigned it after creation. | |
| End status | Completed, Cancelled, Expired, Failed, or Open. | |
| Assigned directly | Yes when the task had an owner from its creation. | |
| Ownership recorded | No when the task is Not recorded (below). | |
| Task time | Task duration, Lag time, Work time | As defined above. Open tasks count up to now (or the As of date); a task that ended without being completed stops counting at its end. |
| Business time | Task duration (business), Lag time (business), Work time (business) | The same, counted in business time. |
| Counts | Claims, Releases, Reassignments | Reassignments counts moves from one person to another (reassign, delegate, return, escalation). Releases are counted separately. |
The instance-level Reassignments count (section 5) counts every hand-off, releases included, so it equals Reassignments plus Releases here.
Measure as of a date. Off: "Off: open tasks count up to now." On: "Tasks created after this date are left out. Tasks still open on this date count up to it, and claims, releases and completions after it are ignored."
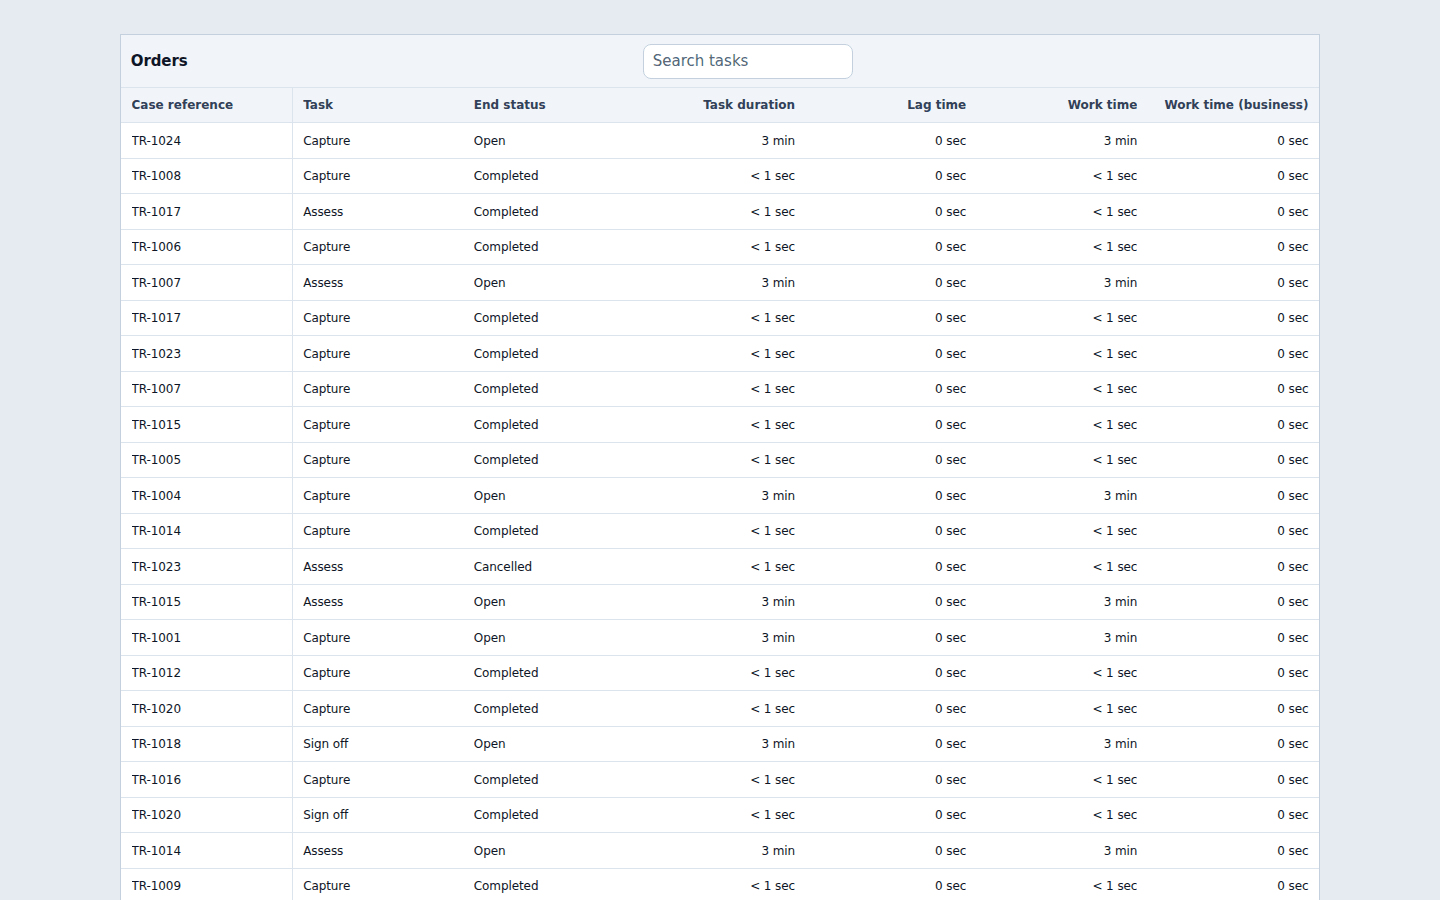
Not recorded: tasks from before the upgrade
Ownership changes are recorded from the upgrade onward, in the same transaction as the change. For tasks that already existed, Inflow rebuilt the ownership history once, at the upgrade, from the records that prove it, and never guessed. The records are the task's audit events (claimed, released, reassigned, delegated, returned, and escalation reassignments), the "Task claimed" and "Task released" system comments, and the task itself (when it was created and completed, its current assignee, and how it was last assigned). A task is rebuilt when one of these applies:
- its owner never changed since creation (it kept the owner it was created with, or never had one);
- it was claimed exactly once and nothing else changed;
- it was created after Inflow started auditing claims and releases, and its audited changes form a complete, consistent chain that matches the task's current owner and its system comments.
The end of a task that was not completed needs its own proof: its own cancellation record or, for a cancelled task without one, the cancellation of its lifecycle instance (the moment the lifecycle instance, or the process the task belongs to, was cancelled, provided that is not before the task was created or last changed). A cancellation comment without that record does not prove the end on its own, and a task whose own comments show it was cancelled earlier (for example when its step timed out) is not given the later cancellation of its lifecycle instance as its end.
Otherwise the task is Not recorded:
- First claimed at, Last owner change at, Lag time, Work time, their business twins, Assigned directly, Claims, Releases and Reassignments read Not recorded, with the hint "Inflow has no record of when this task was claimed or released, so this value is not shown.";
- for a Not recorded task that ended Cancelled, Expired or Failed without a proven end, Task duration, Task duration (business) and Ended at read Not recorded too; a completed or open one still shows its Task duration;
- Ownership recorded is No, so the filter Ownership recorded is Yes keeps only measured tasks;
- averages, medians and other totals skip Not recorded values, so they never pull an average towards 0;
- a Not recorded task stays Not recorded even if someone claims or completes it after the upgrade; it never gets a partial history.
One known limit: a task whose owner was changed through the task inbox without a signed-in actor before 4 September 2026, and whose system comment was then lost by a concurrent save, could be rebuilt as never changed. This needs both an actor-less inbox change and a lost save; no such task was found in the data checked.
Operators: this release installs on a new database only. The installation rules are in
docs/operations/spec-077-upgrade.md.
21. Time in states: per-state columns
On the Lifecycle instances level, the Fields step offers a group Time in states (an entry of its own in the field-group filter). For each state of the latest published version there are five columns:
| Column | What it shows |
|---|---|
| Time in ‹State› | The total time the lifecycle instance spent in that state, over all its visits. |
| Time in ‹State› (business) | The same in business time. |
| Visits to ‹State› | How many times it entered that state. |
| First entered ‹State› at | When it first entered that state. |
| Last left ‹State› at | When it last left that state; empty while it is in that state. |
The values are exactly the totals of the same lifecycle instance's State visits rows (sum, count, first and last), so a table with "Time in Review" and a State visits chart of Review agree.
- A lifecycle instance that never entered a state shows a muted — in that state's columns: empty, never 0 and never "Not set". It is left out of averages, so "average Time in Review" is the average over the lifecycle instances that reached Review.
- The note under the group reads: "Only states of the latest published version are listed. To see time in a state that exists only in older versions, use the State visits level."
- The 200 cap. One connection can have at most 200 state columns. They are counted apart from the 100 variable columns. The badge at the top reads "‹n› of 200 state columns used"; at 200 it turns to a warning and every further state column is disabled with "You can add up to 200 state columns per connection." The server refuses a connection over the cap when it is saved, published or read.
- State columns are never added by default; tick the ones readers need.
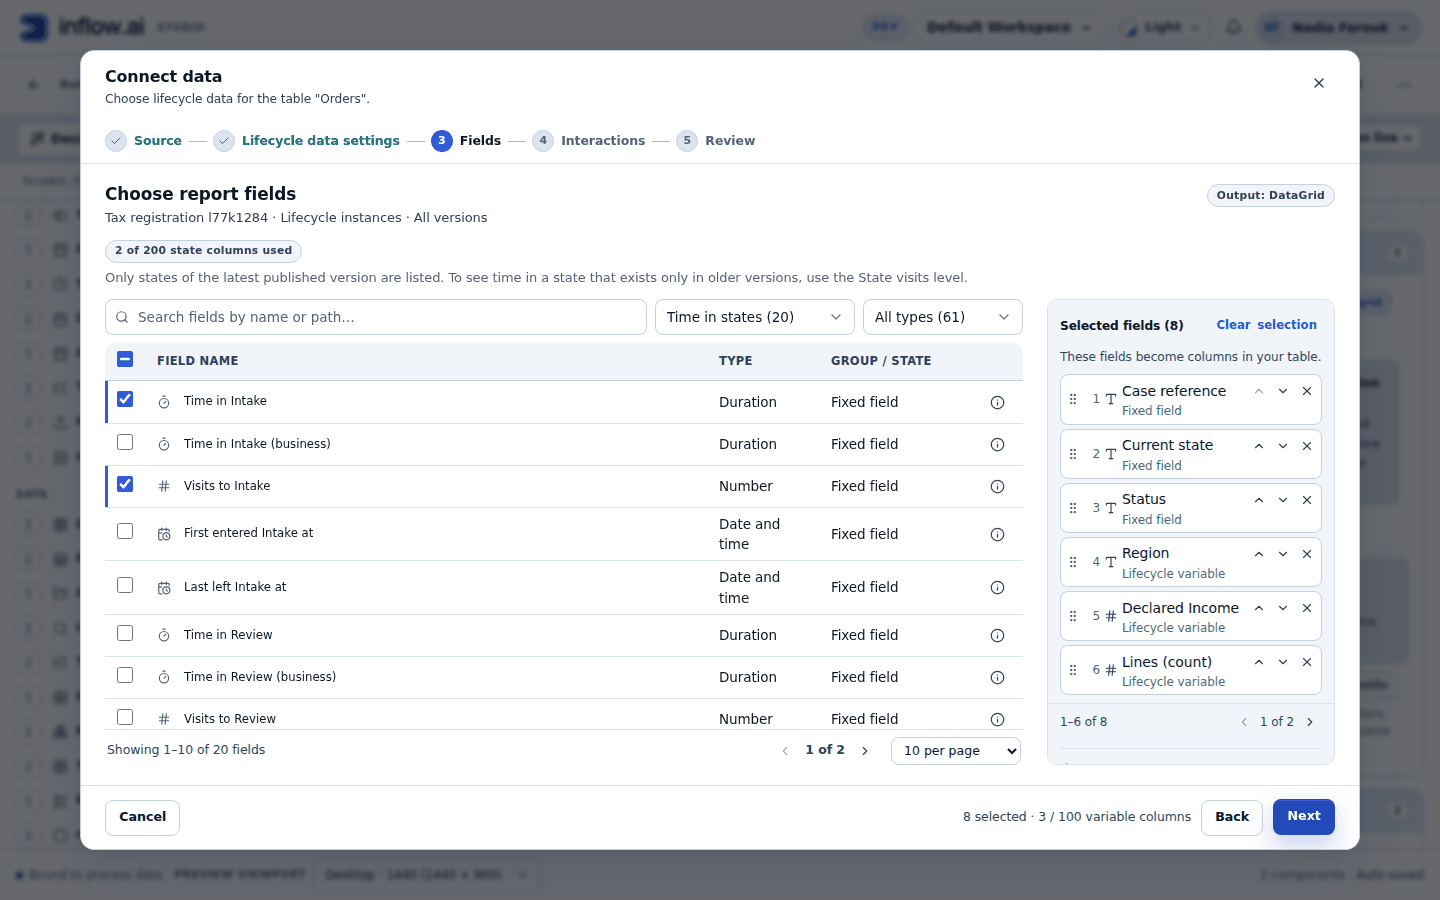
22. Business time and the Business calendar picker
Business time counts only the working time of a business calendar: the calendar's working periods on its working days, in the calendar's own time zone. Weekends (weekdays with no working period) and holidays count as 0. On the dates of an exception, the exception's hours replace the weekly hours; when a holiday and an exception fall on the same date, the holiday wins. For example, with a Sunday–Thursday 08:00–16:00 calendar, a visit from Thursday 15:00 to Sunday 09:00 has a Time in state of 2 days 18 hr and a Time in state (business) of 2 hr.
Every duration on the Lifecycle instances, State visits and Tasks levels has a twin marked (business). The calendar-time field stays the plain one; nothing switches between the two by itself.
The Business calendar picker
The settings of the Lifecycle instances, State visits and Tasks levels have one Business calendar picker, after Filters and before As of. It is not shown on Lifecycle model, Lifecycle instance and Variable history, which have no business-time fields.
- Options: "Default calendar (‹current default name›)", then every calendar of the workspace. Default calendar follows whichever calendar is the workspace default when the page is read; a named calendar stays fixed.
- Help text: "Used by every business-time field of this connection." When no "(business)" field is selected: "Used only when you add a field marked (business)." The choice is kept when you switch level.
- Who can choose: anyone who can edit the connection and holds the Process calendar view or the Screen manage permission. With Process calendar view the options also show each calendar's working week and time zone; with Screen manage alone they show names only, and the help text adds "Working hours and time zone are shown to people with the Process calendar view permission." Without either permission it is disabled with "You need the Process calendar view or Screen manage permission to choose a calendar. This connection uses the default calendar."
- If the calendars cannot be loaded: "Calendars could not be loaded." with Retry; the saved choice is kept.
- If the picked calendar no longer exists: a warning "The picked calendar no longer exists; business times use the default calendar" with Pick another. Business times then use the default calendar.
The "Business time: …" caption
Whenever a grid, a chart or the Data preview shows a business-time field, it names the calendar it used: "Business time: ‹calendar›", followed by the calendar's working week and time zone when Inflow sends them, for example "Business time: Standard · Mon–Fri 09:00–17:00 UTC" (the week and zone are shown only to people with the Process calendar view permission; everyone else sees the name). On a grid it is in the footer, before the row count; on a chart it is in the caption line under the title, joined with " · "; in the Data preview it is the line above the table. The picker's options name the week and zone the same way, for example "Default calendar (Standard · Mon–Fri 09:00–17:00 UTC)". When a picked calendar no longer exists, it reads "Business time: ‹calendar›. The calendar picked for this view no longer exists, so the default calendar is used."
Every "(business)" column header has a tooltip: "Measured in working time of this connection's business calendar." On the Tasks level, Lag time and Work time explain themselves the same way. A business time of 0 whose whole span fell outside the calendar's working hours reads "0 sec (outside working hours)", on every level, whether or not the calendar-time column is shown. When every row of the page reads so, the cells show "0 sec" and one line under the grid says "All business times on this page are 0 sec because they fell outside working hours."
Changing a calendar changes the past. Business times are calculated when the page is read, with the calendar as it is now. Editing a calendar, or making another calendar the default, recalculates the business times already shown, including those of finished lifecycle instances. The Business calendars page warns before such a change (section 24).
23. Duration charts: format, Median and 90th percentile, trends and transitions
How durations read
Every duration — grid cell, mobile card, row detail, chart value label, tooltip, data table, chart summary and reference target — uses one rule:
| Duration | Reads |
|---|---|
| 0 | 0 sec |
| more than 0 and under 1 second | < 1 sec |
| under 1 minute | seconds: "42 sec" (59.999 s reads "59 sec") |
| under 1 hour | minutes and seconds: "1 min 36 sec", or "35 min" |
| under 1 day | hours and minutes: "2 hr 30 min", or "2 hr" |
| 1 day or more | days and hours: "1 day 4 hr", or "3 days" |
Parts are cut, never rounded up, and a zero smaller part is left out. Chart axis labels read the same way as the value labels. A chart whose values are all the same (for example a single 0) still shows an axis range. Count records and Count distinct stay plain numbers. A duration that ends before it starts cannot be measured: its cell reads a muted "—" with the reason "This duration could not be measured: it ends before it starts.", never 0.
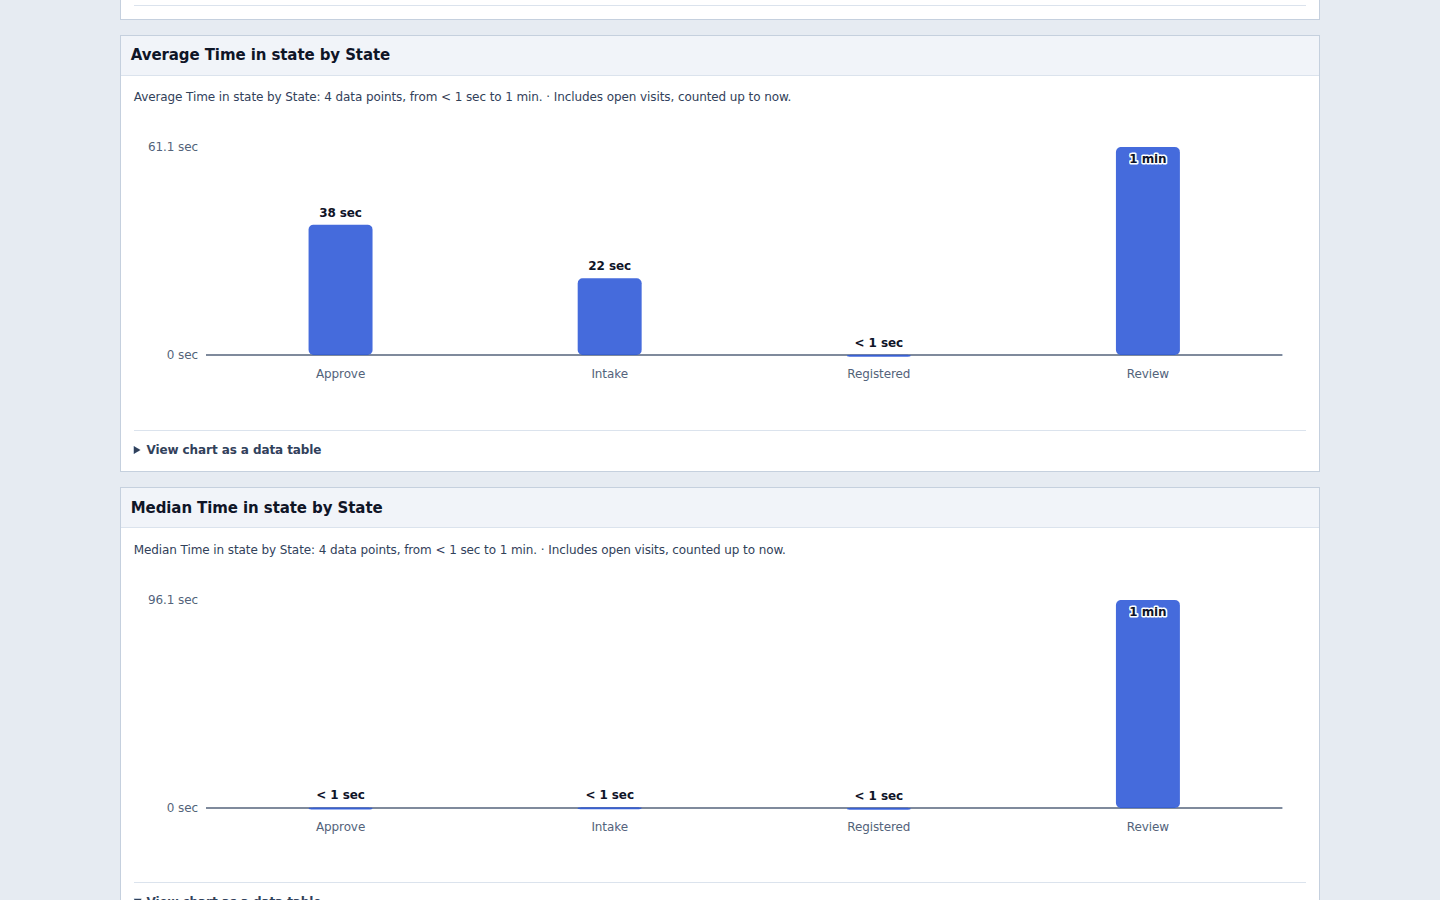
Median and 90th percentile
On Lifecycle data, How to aggregate also offers Median and 90th percentile, for number and duration fields. An average is pulled up by a few very long lifecycle instances; the median is the middle value and is not. The 90th percentile is the value 90% of the group stays at or under — a good "almost always within" figure. The published chart says so in one line: "Median: half of the values are below it and half above." or "90th percentile: 9 in 10 values are at or below it." Empty values (Not recorded, never-entered states) are left out.
Open rows in duration charts
On State visits and Tasks, a duration chart includes open visits and open tasks, counted up to now (or the As of date). The caption says so: "Includes open visits, counted up to now." (or "Includes open tasks, …"). To measure only finished ones, add the filter Visit status is Finished (visits) or End status is not Open (tasks). On Lifecycle instances, use Finished is Yes.
Trends by week or month
Every date-and-time field of State visits and Tasks (Entered at, Left at, Created at, First claimed at, Last owner change at, Ended at) can be the chart category with Group dates by Day, Week, Month, Quarter or Year, as on Lifecycle instances. Periods are cut in the workspace time zone, which is the time zone of the default business calendar, and read for example "Week of Oct 5, 2026", "Oct 2026" or "Q4 2026", in date order.
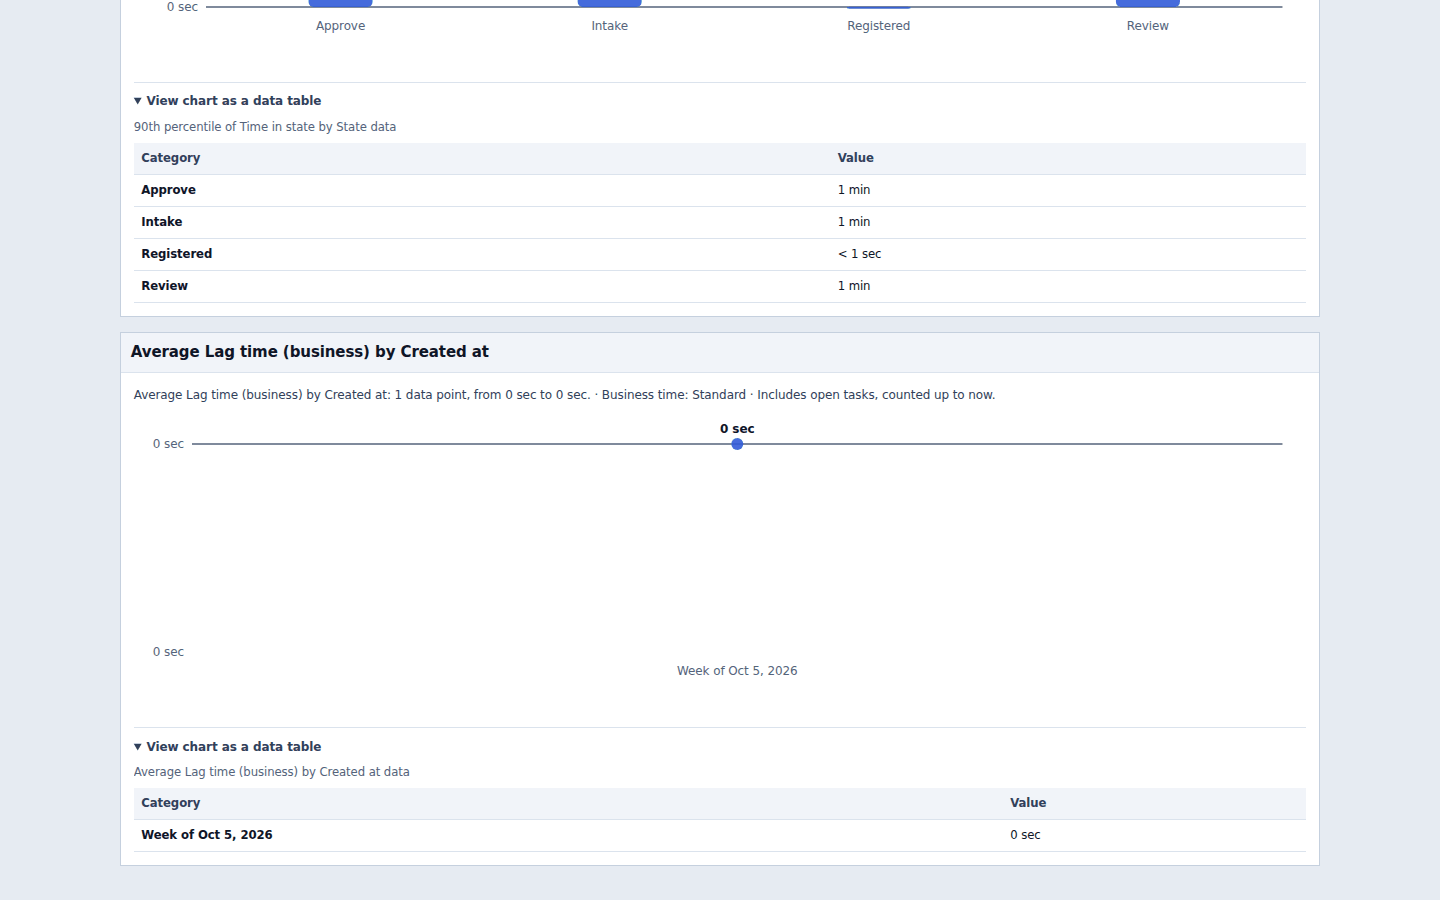
Transitions
On State visits, group a chart by Transition to count the moves between states, for example "Intake → Review". The last visit of each lifecycle instance has no next state yet and is counted under Still open, so the total still equals the number of visits; the caption adds "“Still open” counts visits that have not left their state yet." The same applies to charts grouped by Next state or Left at. Use Wait before next state as the value to see how long the moves take.
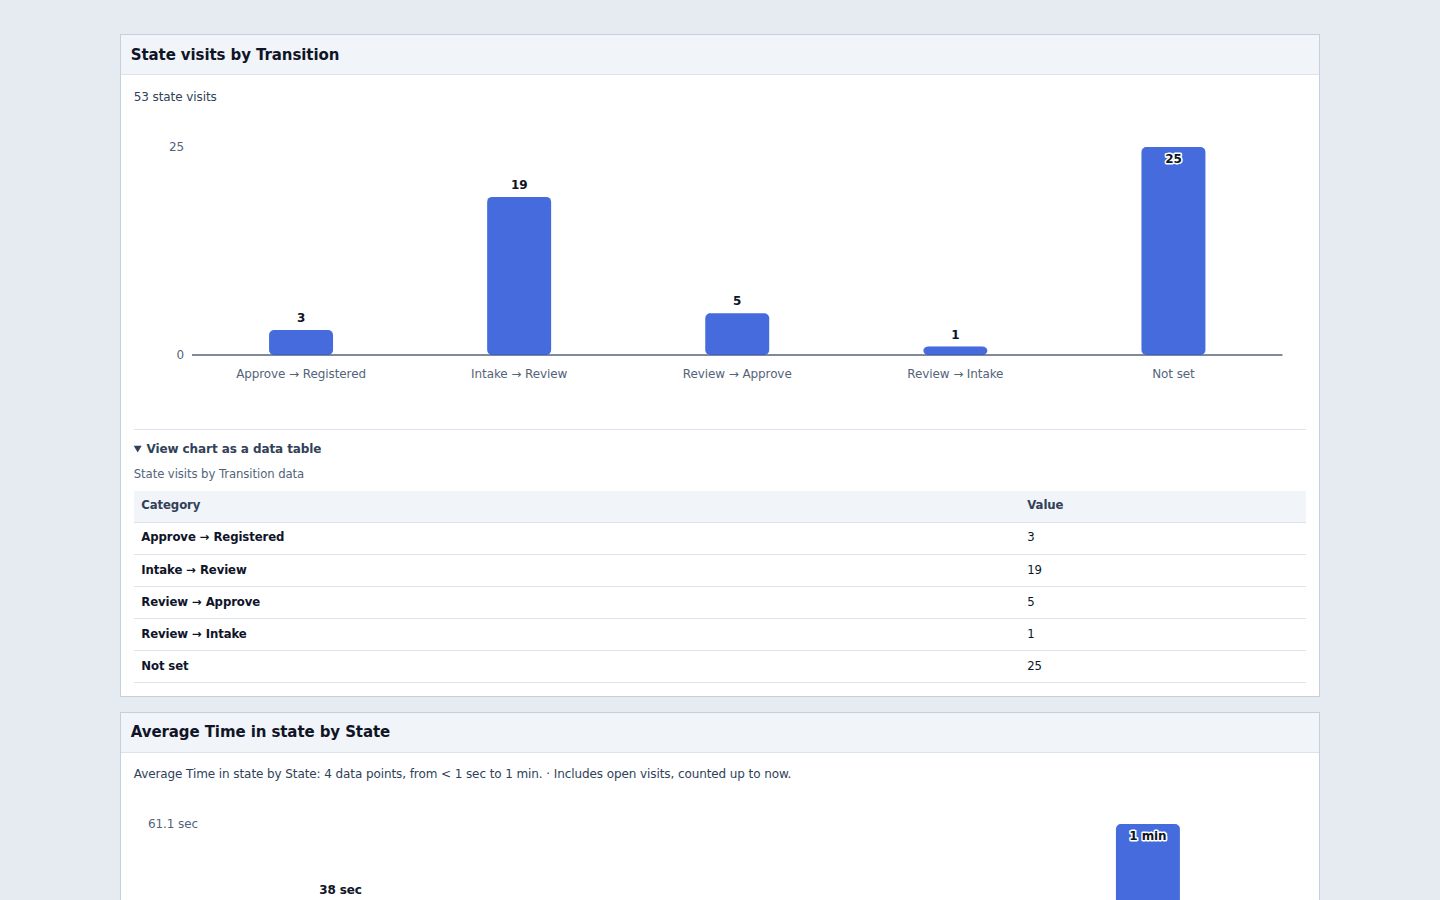
24. Business calendars (administration)
Business calendars decide what "business time" means in a workspace. They are kept per workspace (no calendar is shared between workspaces) on the workspace page, under Settings → Business calendars:
Business calendars — When this workspace works: time zone, working hours, weekends, holidays and exceptions. Business time in lifecycle reports is measured with these calendars.
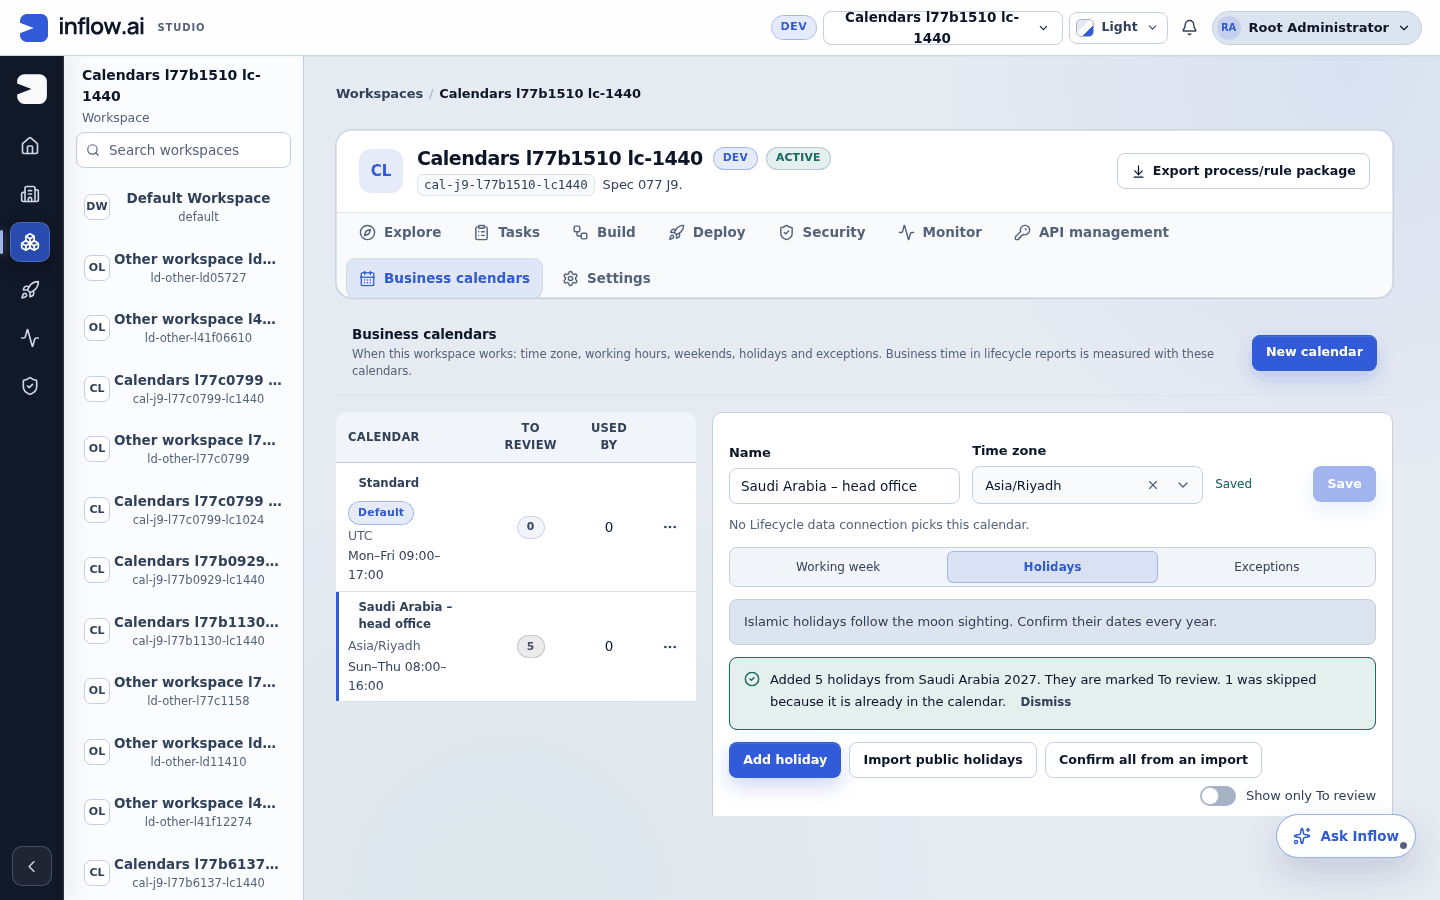
Who can do what
| Permission | What you can do |
|---|---|
| Neither permission | Business calendars is not shown under Settings, and no calendar data is loaded. A saved link to it opens Settings › General when you may see the workspace's general settings; otherwise it shows "This doesn't exist or you don't have access to it." |
Process calendar view (PROCESS_CALENDAR_VIEW) |
See every calendar and its values, read-only: the list, the default badge, the working week, holidays, exceptions and the To review counts. There are no change actions: no New calendar, no row menu, and no edit, add, import or confirm buttons. |
Process calendar manage (PROCESS_CALENDAR_MANAGE) |
Create, edit, duplicate, delete, mark as default, import and confirm. |
The server checks the same permissions on every request, and every change is written to the audit log with who made it and the old and new calendar.
Several calendars, one default
The list shows each calendar with its time zone, a working-week summary (for example "Sun–Thu 08:00–16:00"), how many dates are To review, and Used by: how many Lifecycle data connections pick it by name, plus how many lifecycles measure their service level with it (SCRUM-3390). Its row menu has Mark ‹calendar› as default, Duplicate and Delete. In a narrow window the list becomes a Calendar select, with one line under it giving the chosen calendar's time zone, working week and usage (for example "UTC · Mon–Fri 09:00–17:00 · Used in 2 places").
- Exactly one calendar is the default. It is used by every connection set to Default calendar, by the Process tasks source and by process insights and forecast; its time zone is the workspace time zone for date groups (day, week, month). Its detail says "Also used by every connection set to Default calendar, and by process insights and forecast."
- After the upgrade, a workspace that had a workspace calendar has it as its default, unchanged (named "Workspace calendar"); every other workspace, and every new one, has a default "Standard" calendar: Monday to Friday, 09:00–17:00, UTC.
- New calendar opens a dialog with Name, Time zone and Start from: "Standard week" (Monday to Friday, 09:00–17:00. No holidays or exceptions.) or "Copy of a calendar" (its working week, holidays and exceptions, as they are now). Duplicate opens the same dialog as a copy. Names are unique in the workspace ("A calendar with this name already exists.").
- Mark as default always asks first, for example "Make Saudi Arabia – head office the default?": "Business times already shown in reports will be recalculated with this calendar, including past lifecycle instances." When the time zone changes, it adds "Date groups (day, week, month) in lifecycle reports will use Asia/Riyadh."
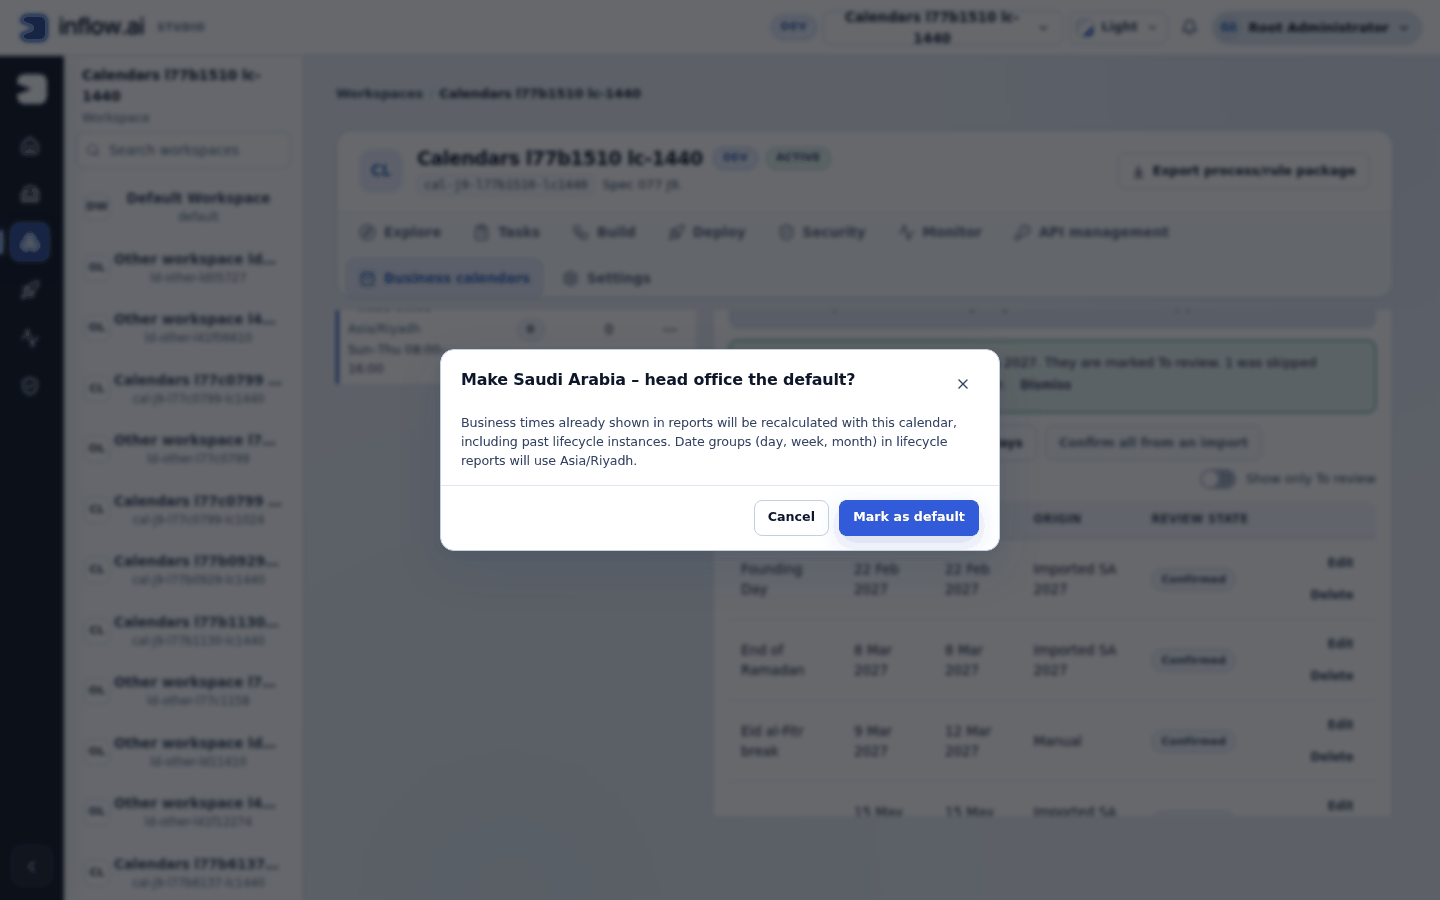
Working week and periods
Each calendar has a Time zone (a named place such as Asia/Riyadh; fixed offsets are refused) and, in the Working week section, one row per weekday in the calendar's own week order (a Friday–Saturday weekend starts the week on Sunday). Each weekday has a switch for whether it is a working day and up to 4 working periods ("A day can have up to 4 working periods."), for example 08:00–12:00 and 13:00–16:00. A weekday without periods is a weekend day and reads "Not a working day". Save saves all three sections at once.
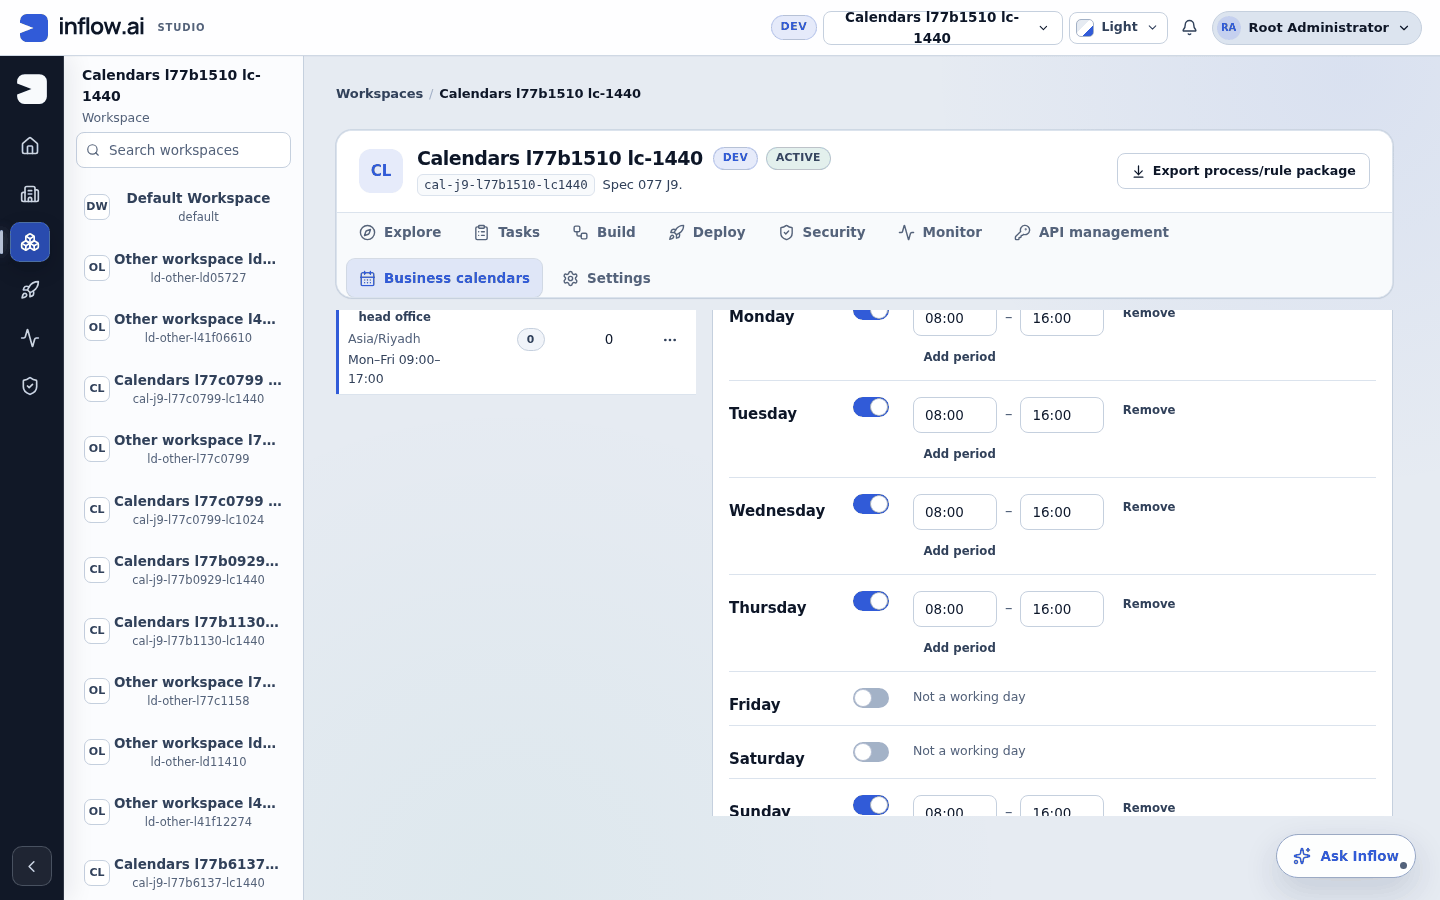
Holidays, exceptions and review
- Holidays are days off: a name and one date or a date range of up to 367 days. Columns: Name, From, To, Origin (Manual, or Imported with country and year) and Review state (To review or Confirmed).
- Exceptions replace the working week on their dates with 1 to 4 working periods, for example shorter Ramadan hours, or work on a normally free day: "On these dates, these hours replace the working week. To close on a working day, add a holiday instead." A holiday on the same date wins.
- Two holidays, or two exceptions, cannot share a date. A calendar holds at most 1,000 holidays and exceptions together.
- Review. Imported dates start as To review. Confirm a row with Confirm, or all rows of one import with Confirm imported dates… (one item per country and year, for example "Saudi Arabia 2027 (5 to review)"). Changing a row's name or dates and saving also confirms it. Show only To review filters the table, and the list's To review count opens that filter.
Hijri entry
The holiday and exception editor accepts each date as Gregorian or Hijri (Umm al-Qura). A Hijri date shows the converted Gregorian date, for example "= 9 Mar 2027 (Gregorian)", and the Gregorian date is what is saved. A day the month does not have reads "This Hijri month has 29 days."; a year outside the supported table reads "Enter a Hijri date between 1300 and 1600 AH, or switch to Gregorian."
Importing public holidays, and the yearly Eid confirmation
Import public holidays opens a dialog: "Choose a country and year. Nothing is added until you import."
- Choose the Country (Saudi Arabia, United Arab Emirates, Bahrain, Kuwait, Oman or Qatar) and the Year (last year to two years ahead). The preview lists the holidays; Saudi Arabia includes Founding Day (22 February).
- A date that is already a holiday in the calendar is marked Already in calendar and skipped ("This date is already a holiday in this calendar, so it will be skipped."). Untick any other row you do not want.
- Press Import ‹n› holidays. The result reads, for example, "Added 5 holidays from Saudi Arabia 2027. They are marked To review. 1 was skipped because it is already in the calendar." An import never changes a row that is already there.
- Check each imported date and confirm it, or edit it. Once every date of the import is confirmed, the result line says "They are confirmed." instead (while some are left, how many are still To review).
Confirm Islamic holidays every year. Eid al-Fitr, Eid al-Adha, Arafat Day and the other Islamic holidays follow the moon sighting, so the imported dates are estimates and can move by a day. The Holidays section says so: "Islamic holidays follow the moon sighting. Confirm their dates every year." Import the coming year once it is known, correct the dates after the announcement, and confirm them. Nothing is refreshed automatically: the holiday data is used only when you import, never when business time is calculated.
Changes that recalculate history
Saving a calendar that is the default or is picked by a connection asks first, in the dialog Recalculate business times?, with the same warning as Mark as default (and the time-zone sentence when the default's zone changes). An import into such a calendar shows the warning above its import button. Confirming dates changes no date and asks nothing.
If someone else saved the calendar while you edited it: "Someone else changed this calendar. Reload to see their changes." Your edits stay visible until you choose to reload. Leaving with unsaved changes asks "Unsaved changes" first.
Deleting a calendar
Delete asks you to type the calendar's name. Two kinds of calendar cannot be deleted; the dialog then turns into Cannot delete ‹calendar›, with the reason, Close, and Go to connection for each interface you may edit — there is no delete button left to press. Go to connection opens the interface for editing, so it is not shown for an interface you may view but not edit; the reason then asks someone who can edit it:
- the default: "This is the default calendar. Mark another calendar as default first.";
- a calendar picked by a Lifecycle data connection, in a draft or a published interface: for example "Used by 1 interface: Orders dashboard. Change its Business calendar setting first." Interfaces you cannot open are never named or counted; when only those remain, the refusal is "This calendar is still in use, so it can't be deleted." The Used by figure in the list also counts only interfaces you may open. When you may view an interface but not edit it, the refusal asks someone else instead: "Ask someone who can edit Orders dashboard to change its Business calendar setting."
- a calendar a lifecycle's service level measures with (working time, with this calendar chosen), in the lifecycle's draft or its latest released version (SCRUM-3390): for example "Used by the service level of 1 lifecycle: Purchase request. Choose another calendar for it first." Choose another calendar in the draft (and release it, if the latest released version uses it) to free the calendar; older released versions do not count. The dialog offers Go to ‹lifecycle› for each lifecycle you may change; a lifecycle you may only view is asked of someone else ("Ask someone who can change Leave to choose another calendar."). Only lifecycles you may view are named; the others count toward the neutral "still in use" sentence the same way as interfaces. A service level on the default calendar or measured in calendar time never counts. The calendar's editor names these lifecycles too ("Used by the service level of Purchase request.").
The older calendar API
GET /api/process-calendar and PUT /api/process-calendar keep working on the default calendar. When the
default uses something the older shape cannot express (more than one period a day, different hours per day, date
ranges or exceptions), GET says so and PUT is refused rather than silently dropping it. The older PUT now also
needs the manage permission and is audited.
Glossary
| Term | Meaning |
|---|---|
| Lifecycle model | The published definition of a lifecycle, with every version: its states, transitions, lifecycle variables, and the state process of each state. |
| Lifecycle instance | One run of a lifecycle model, from start to its end (other Studio pages may say "case"). One lifecycle instance is one row at the "Lifecycle instances" level. |
| State | A stage of a lifecycle model, for example Intake, Review or Approve. Never called a "step". |
| State process | The process a state runs while a lifecycle instance is in that state. |
| State process instance | One run of a state process for one lifecycle instance. A lifecycle instance has one per visit to that state. It never becomes a row of its own at the "Lifecycle instances" level. |
| Step (node) | One element of a state process: a task, a service step, a gateway and so on. In copy it is "Step". |
| Lifecycle variable | A variable declared on the lifecycle model (its case file), shared by every state. Shown by its label, for example "Region". |
| Process variable | A variable declared on a state process. Shown as "<State> › <Variable>", for example "Intake › ClaudeLovesToEatTokens". |
| Variable history | The record of every accepted change to a variable: who changed it, when, the old and new value, where (state › step), and the origin. |
| Lifecycle data (the source) | The one Connect data source this spec adds. |
| Level | Which question Lifecycle data answers: Lifecycle model, Lifecycle instances, Lifecycle instance, Variable history, State visits or Tasks. In Connect data it is the row-meaning tile under "What should each row represent?". |
| Variable column | A selected field that is a variable: a lifecycle variable, a process variable, a record field, or a List's count. At most 100 per control. Fixed fields and the instance counts are not variable columns. |
| State visit | One stay of a lifecycle instance in a state, from entering it to leaving it. A row of the State visits level. Open while the lifecycle instance is still in that state. |
| Lag time | The time a task had no owner (unclaimed, or released and not yet claimed again). |
| Work time | The time a task had an owner (claimed or assigned). Lag time + Work time = Task duration. |
| Not recorded (task) | A task from before the upgrade whose records cannot prove when it was claimed or released; its lag and work values are not shown and are left out of totals. |
| Business time | Time counted only within the working periods of a business calendar, skipping weekends and holidays. Fields marked "(business)". |
| Business calendar | A workspace's definition of working time: time zone, weekly working periods, holidays and exceptions. One per workspace is the default. |
| State column | One of the five Time in states columns of a state on the Lifecycle instances level. At most 200 per connection, apart from the 100 variable columns. |
| Designer preview sample | The lifecycle instance chosen under Designer preview → Preview with at the Lifecycle instance level. Used only for the Data preview; never published. |
Screenshot list (to do)
Spec 041 captures (LC). The Connect data images in this manual are the LC captures, taken from the running
Studio by studio/frontend/tests/interface-designer-certification/product/lifecycle-connect-screenshots.spec.ts
on lane l22 (runs l41s40551 and l41s41399, both green, candidate commit 7bbfd7e19), at 1440×900 and 1024×768, with the dialog
geometry checked on every capture (index: lanes/l22/screenshots-041/index.md, outside the repository). They
are in docs/manuals/screenshots/lifecycle-connect/ (the 1440 versions this manual cites, copied from run
l41s41399; the 1024 versions, named …-1024.png, stay in the lane folder).
- [x]
LC-01-settings-instances-preview-1440.png— Lifecycle instances settings beside a ready Data preview with the real total (section 3). - [x]
LC-02-settings-model-version-1440.png— Lifecycle model level, version 2 chosen, with its preview (section 8). - [x]
LC-03-settings-instance-designer-sample-1440.png— Lifecycle instance from this page, with the Designer preview sample and its "not published" note (section 6). - [x]
LC-04-history-subset-dates-1440.png— Variable history, All variables off with two variables, Changed from and Changed to (section 7). AlsoLC-04-history-all-variables-on-…andLC-04-history-subset-kept-…. - [x]
LC-05-as-of-banner-1440.png,LC-05-as-of-value-not-recorded-1440.png— As of note and banner; "Value not recorded" on Intake › Tax Id (section 9). - [x]
LC-05-as-of-historical-value-1440.png— As of an earlier day reads the value recorded that day (the "As of history" model: Amount 100, changed to 250 on a later day). As of is a whole day, so the capture needs two UTC days on the lane; the first run (2026-10-04) seeded it. - [x]
LC-06-settings-from-this-page-prefilled-1440.png— From this page with Show variables of prefilled (section 4). - [x]
LC-07-fields-region-income-1440.png— Fields with Region and Declared Income selected (section 3). - [x]
LC-08-fields-duplicate-labels-details-1440.png— Two fields named Notes; details of Review / Notes open (section 3). - [x]
LC-09-fields-long-selected-list-1440.png,LC-09-published-column-order-1440.png— A paged Selected fields list with drag handles; the published table in that order (section 3). - [x]
LC-10-fields-100-valid-1440.png,LC-10-fields-101st-refused-1440.png,LC-10-fields-loaded-101-draft-1440.png— The 100 variable columns rule (sections 3 and 15). - [x]
LC-11-preview-empty-1440.png,LC-11-preview-no-access-1440.png,LC-11-preview-failed-network-1440.png— Data preview states (section 14). AlsoLC-11-preview-loading-…,LC-11-preview-stale-refreshing-…andLC-11-preview-failed-failure-…. - [x]
LC-12-constant-valid-1440.png,LC-12-constant-retired-1440.png— The Lifecycle model constant, valid and retired (section 11). - [x]
LC-13-interactions-notice-1440.png,LC-13-review-needs-correction-1440.png,LC-13-review-preserved-bindings-1440.png— Needs correction on Interactions and Review, and Review after the corrections (section 3).
Spec 077 captures (lifecycle time KPIs and business calendars, SCRUM-2998). Taken from the running Studio by
the journeys lifecycle-time-levels.spec.ts, lifecycle-time-charts.spec.ts (consultant persona) and
lifecycle-time-calendars.spec.ts (J9, administrator) in
studio/frontend/tests/interface-designer-certification/product/ on lane l77, at 1440×900 and 1024×768 (source
folder lanes/l77/screenshots-077/, outside the repository). The 1440 versions this manual cites are in
docs/manuals/screenshots/lifecycle-time/, reduced to a 256-colour palette to keep the repository small; the
1024 versions and the root-persona captures stay in the lane folder.
- [x]
j1-visits-calendar-picker-1440.png— State visits and Tasks tiles, the Business calendar picker and As of beside the Data preview (section 19). - [x]
j1-visits-runtime-caption-1440.png— Published State visits table with the "Business time: Standard" caption (section 19). - [x]
j2-tasks-runtime-1440.png— Published Tasks table with Task duration, Lag time and Work time (section 20). - [x]
j4-state-columns-1440.png— Time in states with "2 of 200 state columns used" (section 21). - [x]
j5-transitions-1440.png,j6-trend-1440.png,j7-durations-1440.png— Transition, weekly business-time trend and duration charts (section 23). - [x]
j9-03-working-week-edited-1440.png,j9-05-hijri-entry-1440.png,j9-06-import-preview-1440.png,j9-07-imported-to-review-1440.png,j9-09-default-change-warning-1440.png,j9-12-delete-in-use-named-1440.png— Business calendars (section 24).
Other images (spec 022). Capture each in the CBF lane with the "Tax registration" fixture, Studio at 1440 px,
designed surfaces in English and Arabic. Save under docs/manuals/screenshots/lifecycle-data/.
- [ ]
instances-grid.png— Published Lifecycle instances grid: Case reference, Current state, Status, Region, Declared Income, "1–25 of 1,284". - [ ]
instance-task-form.png— Review task form with the changes grid and the Current values grid. - [ ]
history-grid.png— Published Variable history grid filtered to Declared Income, last 90 days. - [ ]
chart.png— Chart, count by Current state split by Region. - [x]
review-required.png— Publish review with the "Review required" note and "Publish anyway". - [ ]
protected-reader.png— Dashboard as a reader without view access: Protected cells, the sort notice, the filter empty state and the one "Protected" chart group. - [ ]
arabic-dashboard.png— The same dashboard in Arabic, right to left.